


A Genetic Analysis of Historical Population Movements Around The Zagros Mountains
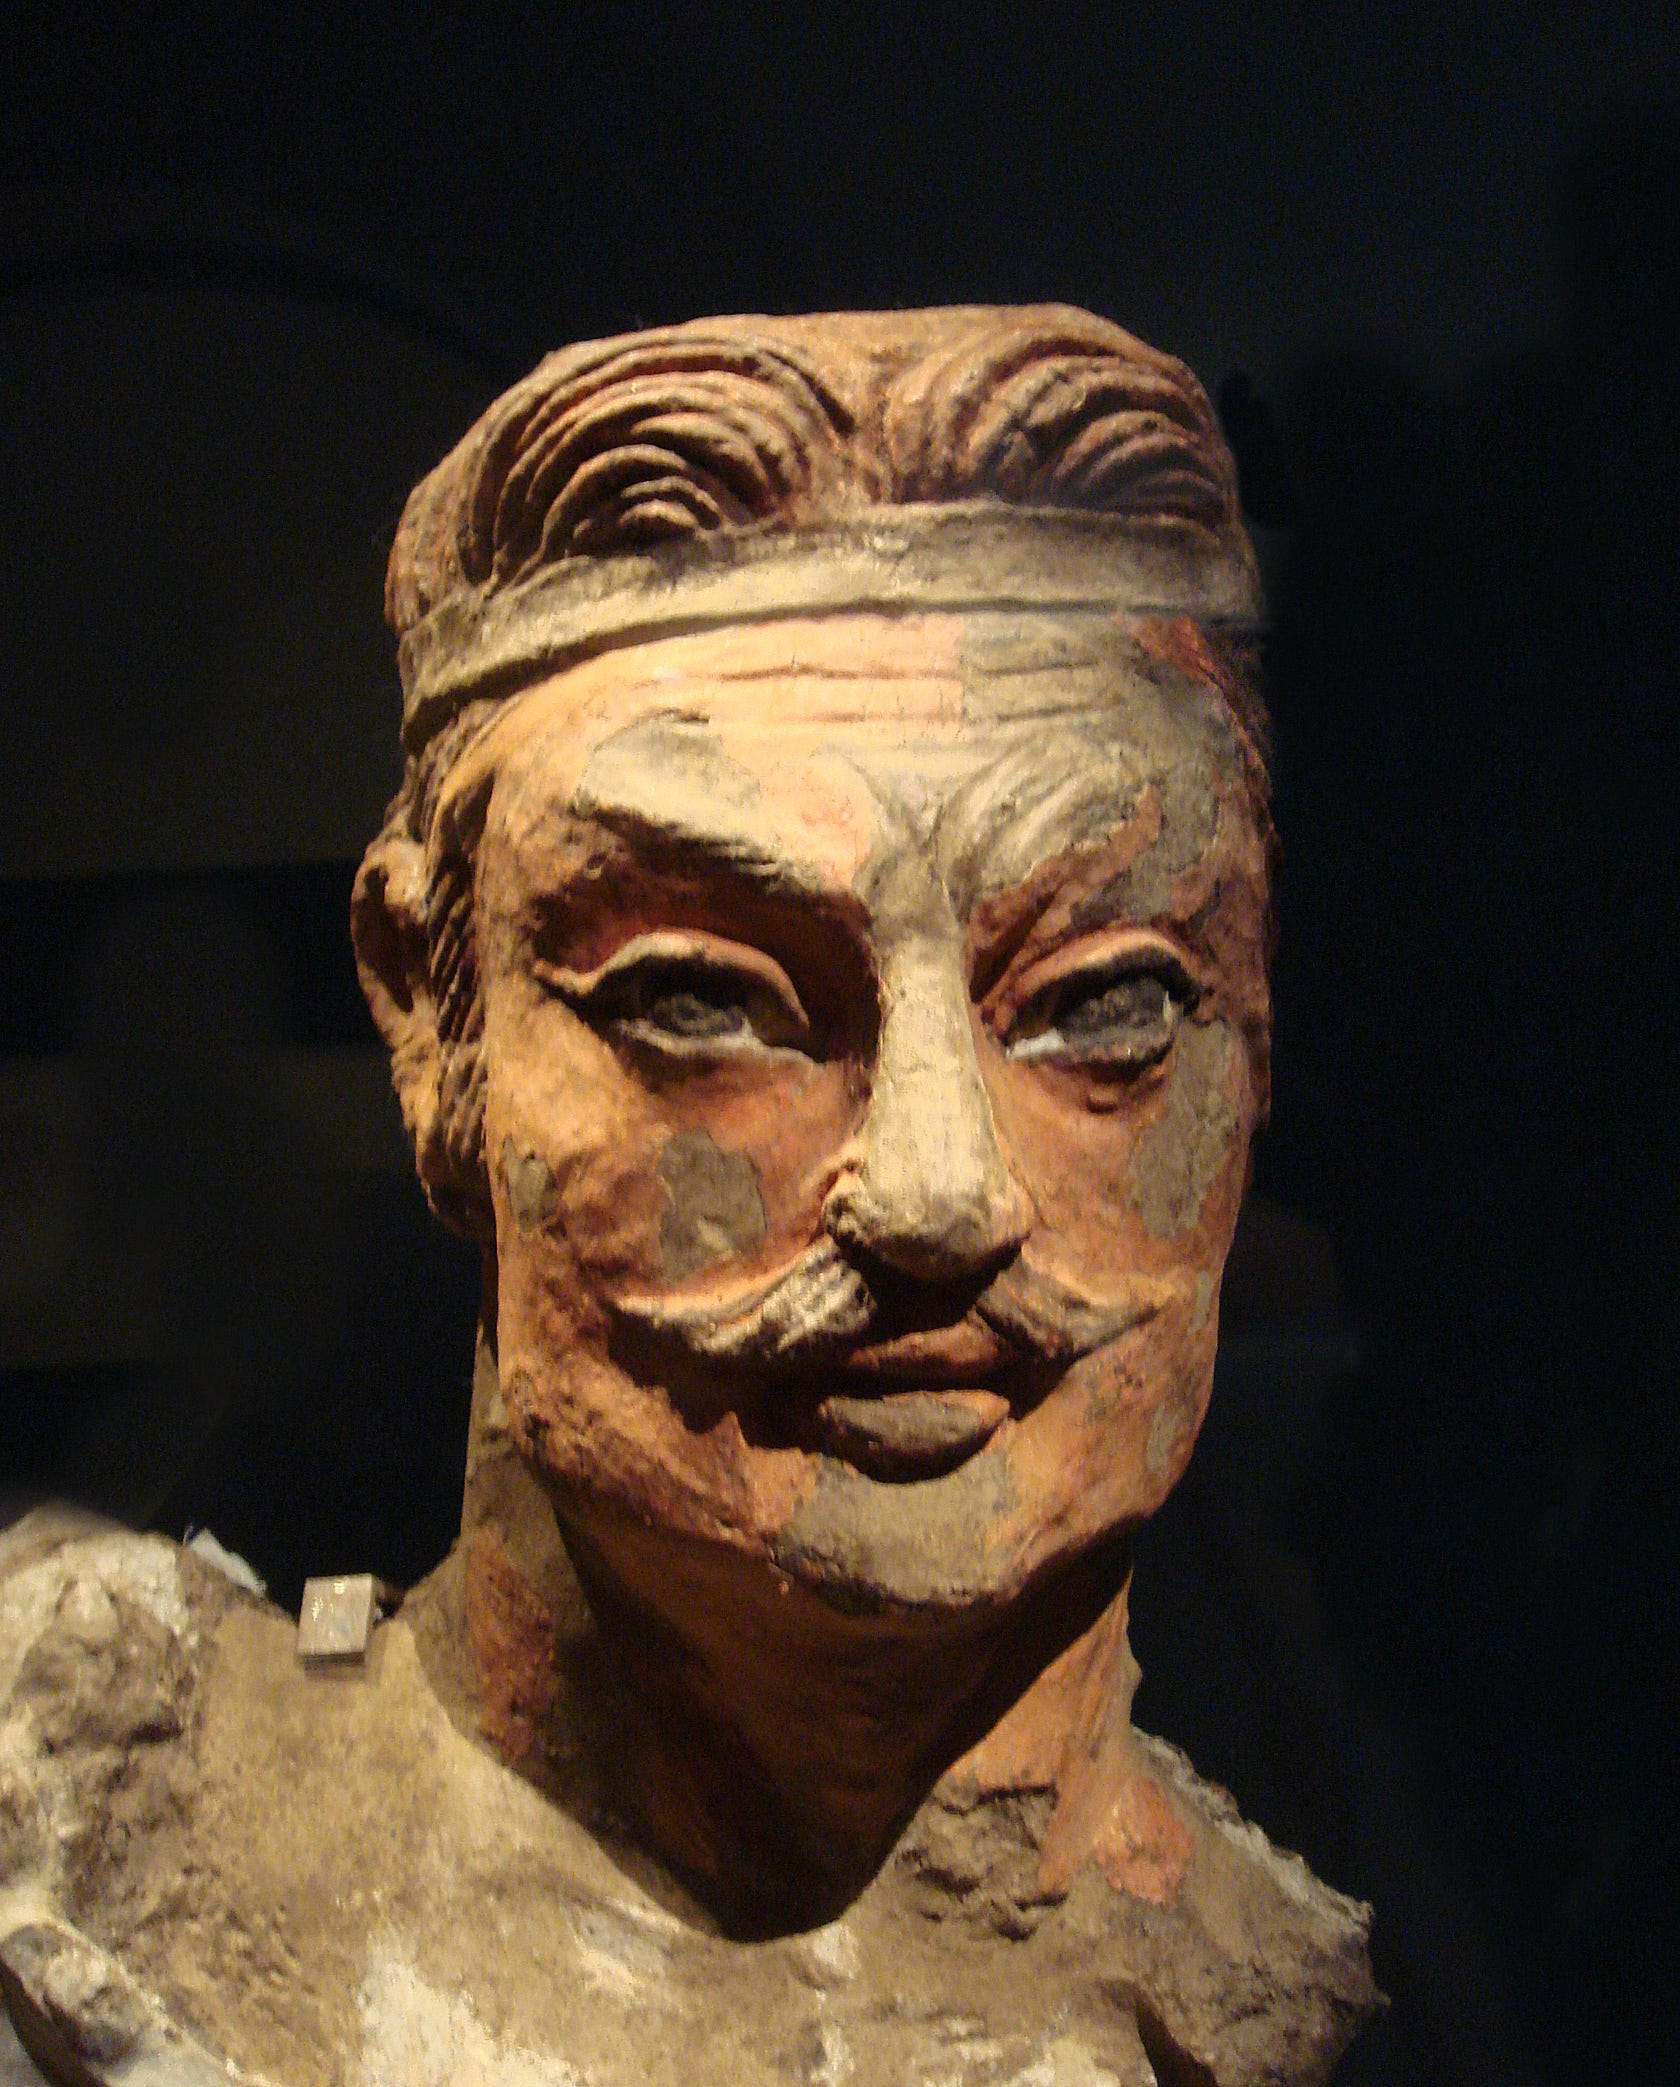
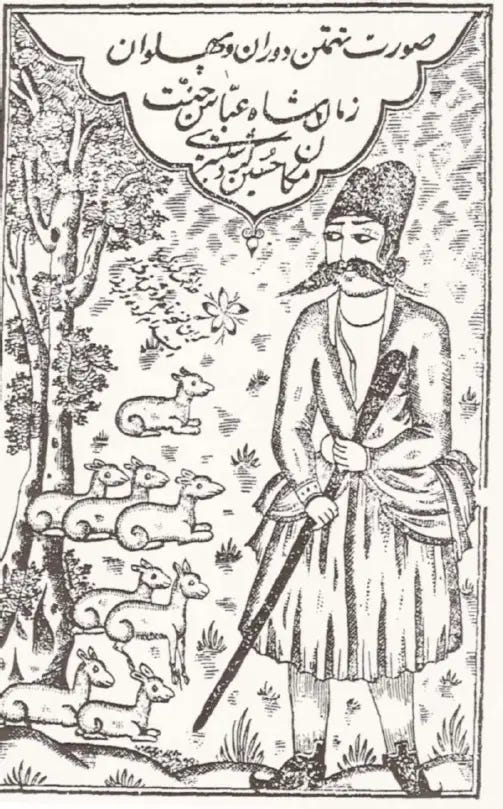
and also an image gallery of untrimmed moustaches since at least the Iron Age

Introduction and Methods
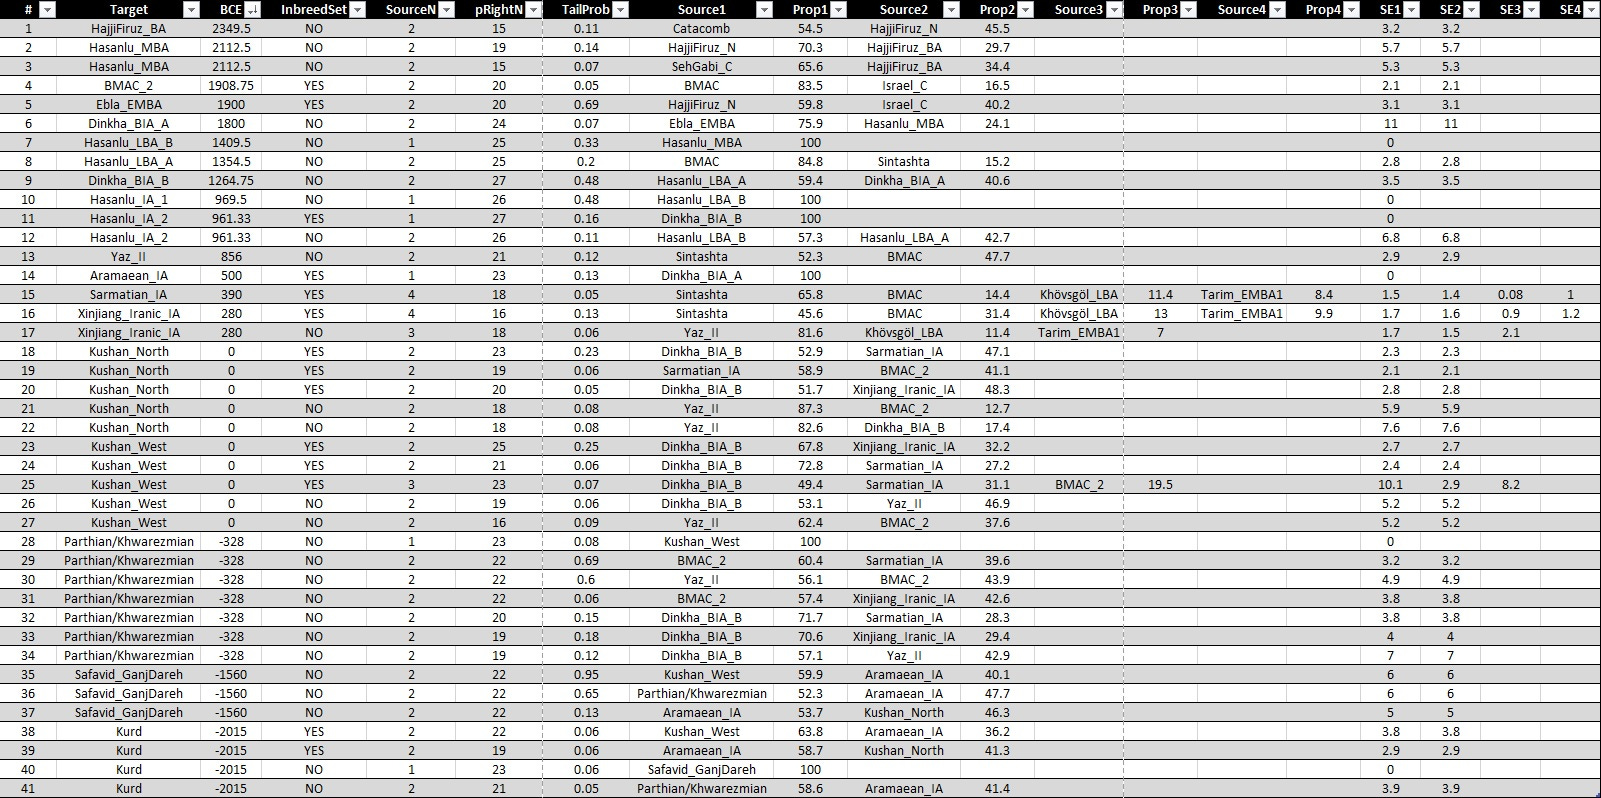
With the recently published Southern Arc paper1 we have acquired a good amount of samples to draw a picture of the history of the population movements around the Zagros region. Since among these samples there are of the different migrants who seem to be genetically related to Central Asian or Mesopotamian populations of the old we have covered these regions too to some extent. To analyze the samples we have used the formal tool qpAdm and to render its results as reliable as possible we chose to follow criteria such as using one type of data only whenever possible, using more than one sample for each population whenever possible and thus being able to use inbreed: YES option for qpftats, excluding questionable samples, using diverse set of populations as reference (sometimes referred to as outgroup or right pop), etc. Also to test the solidity of each model we have added as many as reference populations until the p-value drops just above 0.05, which is the generally accepted threshold. Thus validating these models based on reference size and diversity rather than p-values would make much more sense. As in our previous articles, the list of the IDs of the samples that have been used, the data sources and the qpAdm outputs of each chart, which include all the technical details needed to be sure of the validity of our models, can be found in the supplementary material.2 Also to make it easier we have added a table at the end of the article which shows all the p-values, standard errors and reference population sizes and under each chart the number of the model has been stated for readers who would like to find the details.
As a note, we would like to emphasize that although our qpAdm models are quite reliable, some of our conclusions about the ethnicities of various ancient populations are highly speculative. Your help to identify them based on our models and historical knowledge you have would be appreciated.
Bronze to Iron Age Zagros
HajjiFiruz_BA
The earliest sample (circa 2350 BCE) to be analyzed in our study is I4243, a Bronze Age sample from Hajji Firuz Tepe, Northwestern Iran and can be modeled as below:
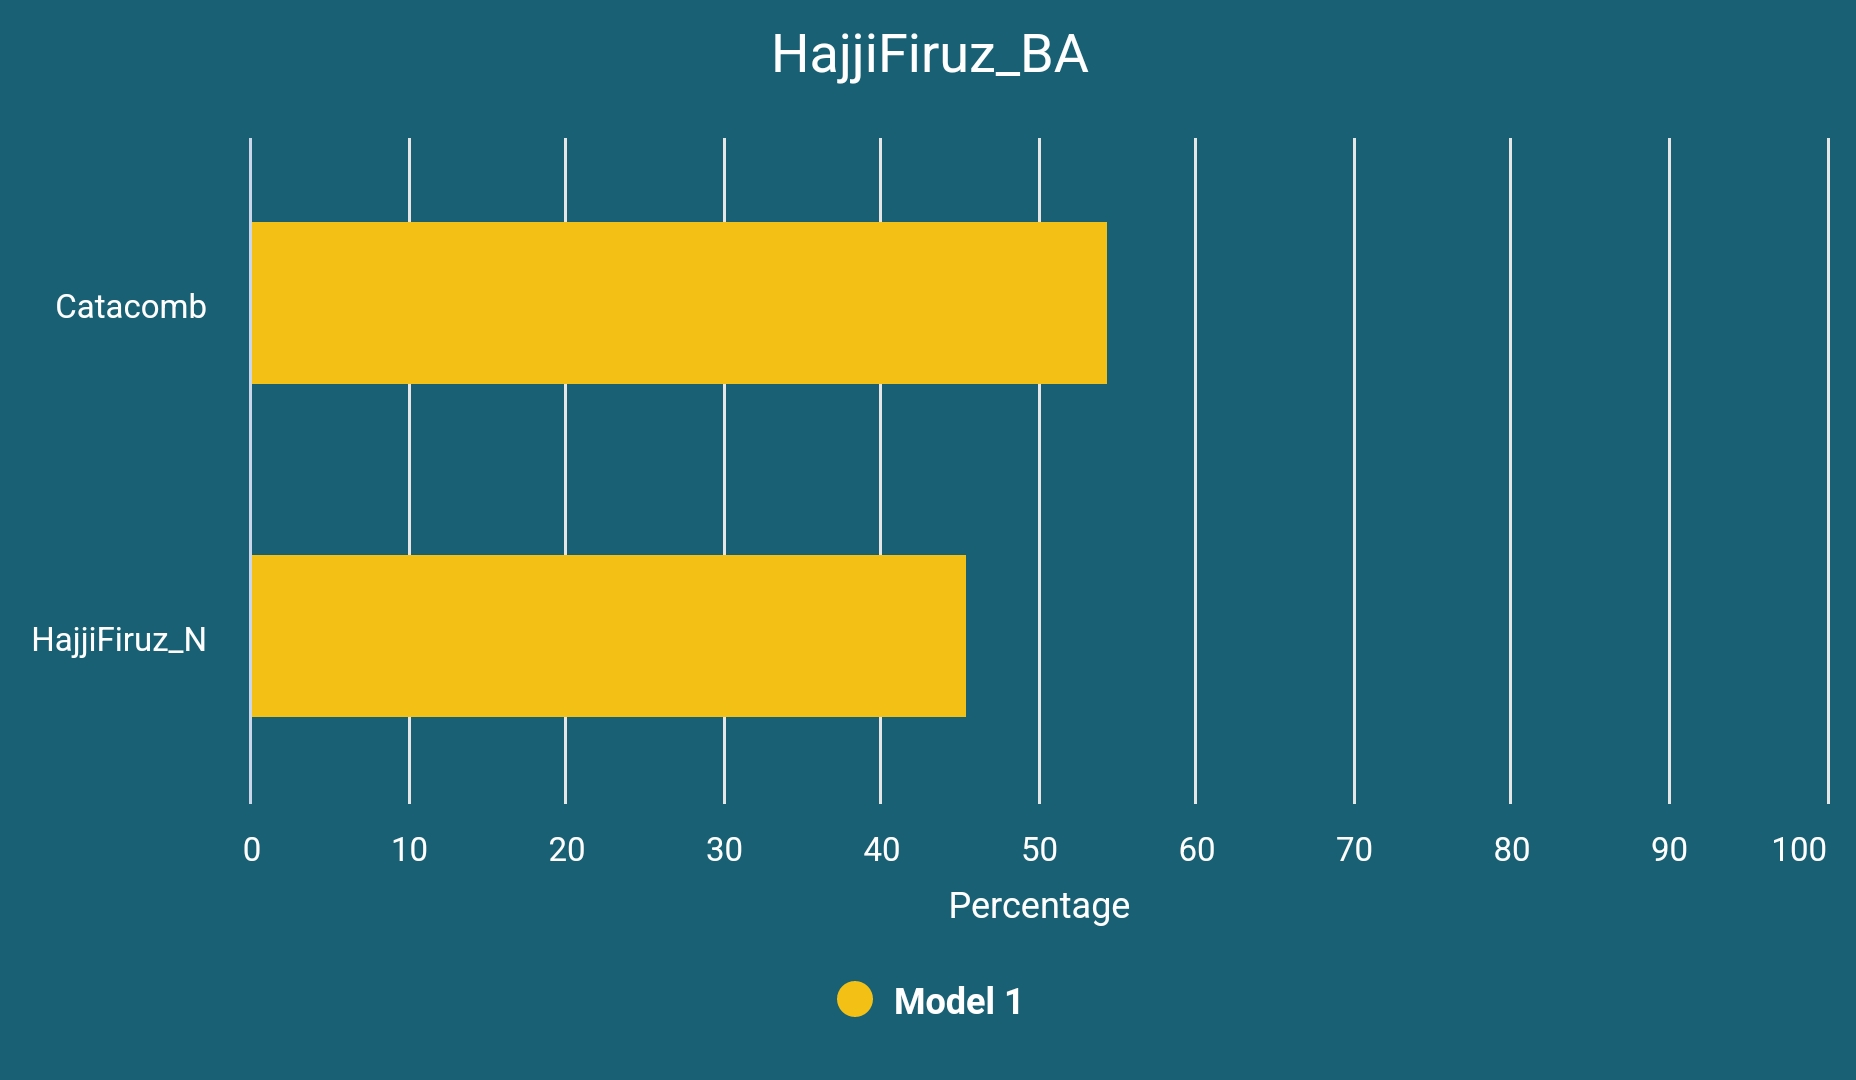
What we see here is almost a 50-50 mixture of native populations of Zagros (represented here by Neolithic Hajji Firuz Tepe samples, previously labeled as Chalcolithic) and migrants from the Catacomb Culture, which was a Pontic-Caspian steppe culture associated with early core Indo-European (the stage after the Anatolian and Tocharian splits) speakers who were most likely the linguistic ancestors of Albanians, Armenians and Greeks. We do not know what language has been spoken by the natives of the northern Zagros region at that time or the language of this sample at hand; it might be something related to Lullubian, Gutian or most likely Turukkaean, the languages we know almost nothing about, or neither of them. Either way they were probably one of the tribes the Akkadians described as wild and barbarian.
The possibility of their steppe-related ancestry to be from Poltavka Culture (instead of Catacomb) which is thought of as ancestral to later Indo-Iranics of the steppe should be noted.3
Hasanlu_MBA
Our second sample, I4354, a Middle Bronze Age sample (circa 2100 BCE) from Hasanlu Tepe displays the first example of the genetic profile that was lasting in the region for at least thousand years and can be modeled as below:
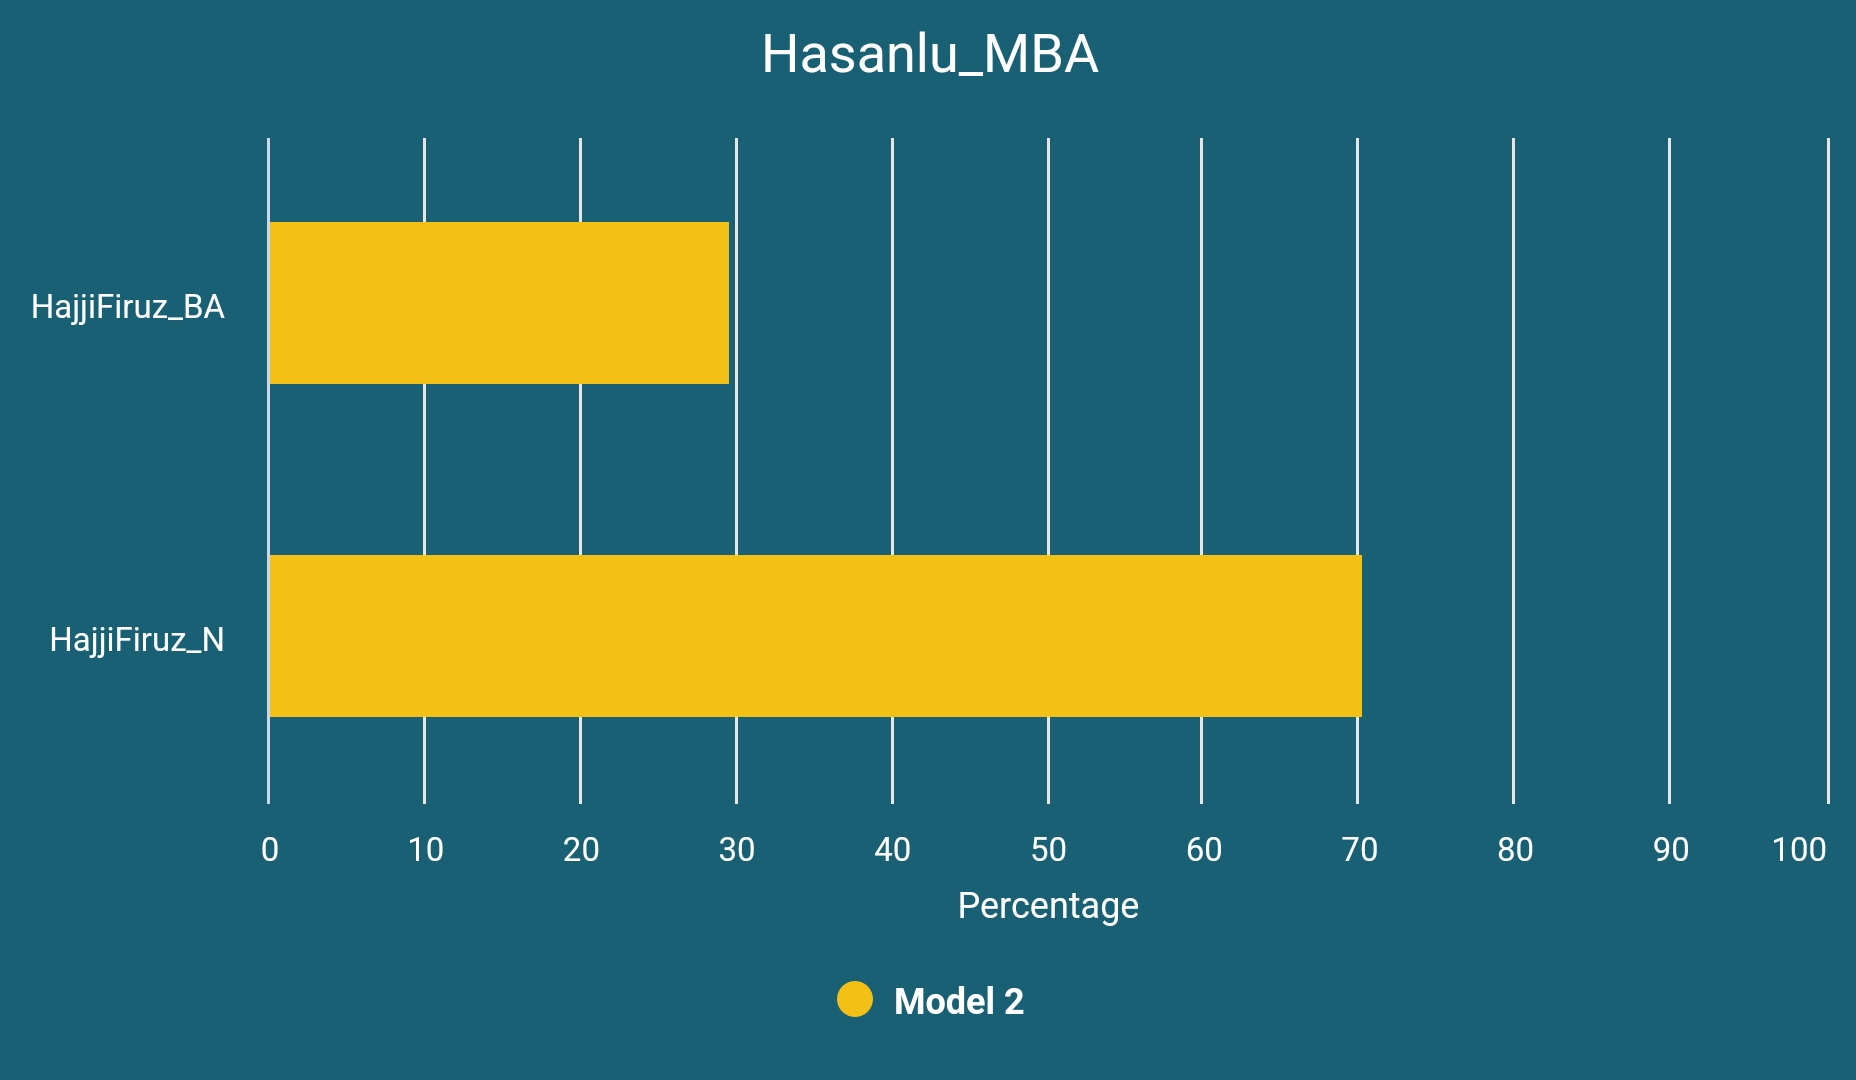
If our model is successful in terms of being close to reflecting the historical reality then we can see this as a result of continuous homogenization of steppe migrants and natives of the region. As you will see soon, this genetic profile has been subsisted in the region until at least the Early Iron Age.
DinkhaTepe_BIA_A
The samples that are labeled as DinkhaTepe_BIA_A (n=6) are dated to 2012-1749 BCE except one which is dated to almost 800 years later and also seems to have additional ancestry, thus excluded (another sample is excluded too because of the ancient DNA damage, leaving us with four samples).

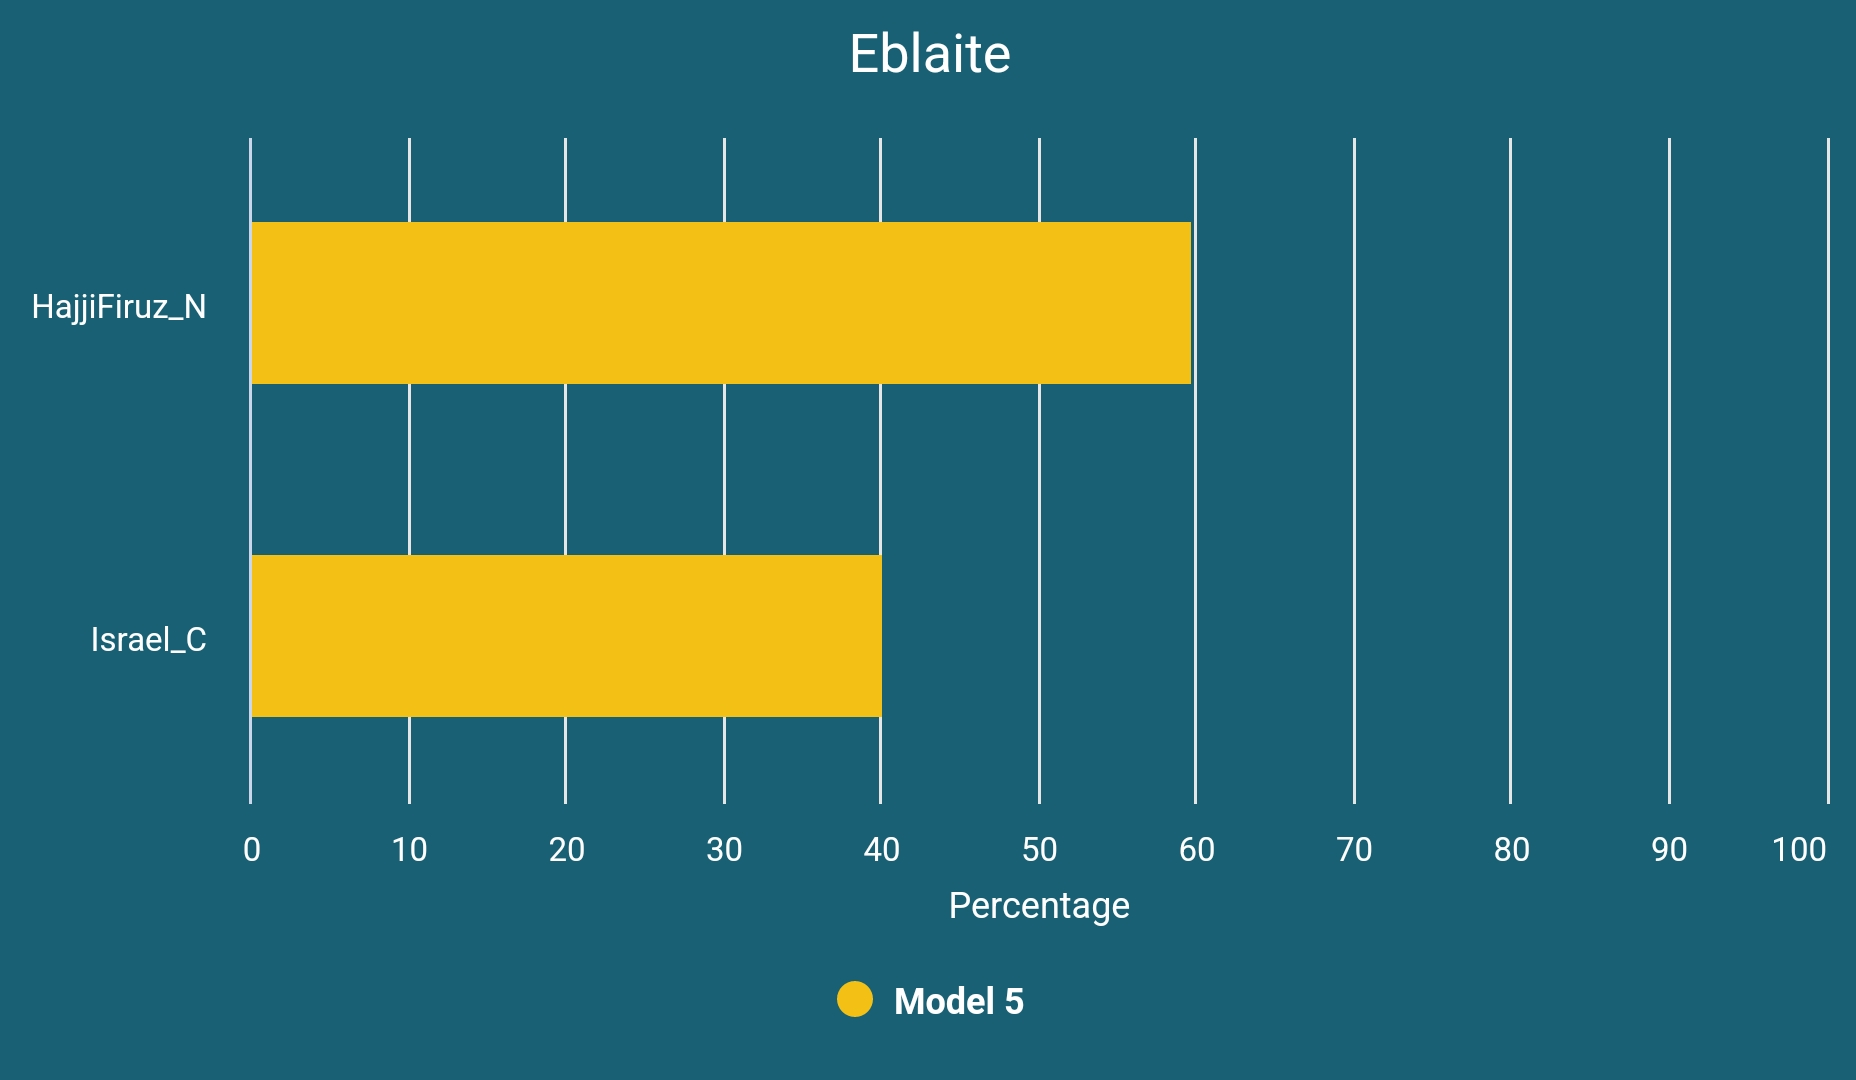
These samples clearly have Mesopotamian-related ancestry to a high degree, represented in our model by Eblaites; therefore it is reasonable to assume that they were either East Semitic-speaking migrants related to Akkadians, or more likely Hurrians, considering the first known Hurrian kingdom was emerged around the city of Urkesh and the existence of similar ancient samples around Van. If the dating of the sample that we have excluded is true then it is safe to conclude that these migrants were also subsisted in the region for a long time.
We have decided to share an analysis of Eblaites too for those who would like to learn more about their deeper ancestry:
Hasanlu_LBA_B
This sample, I4098, which is dated to around 1400 BCE is basically the continuation of the Hasanlu_MBA.
Hasanlu_LBA_A
The sample I4097, dated to around 1350 BCE, can be modeled as below:
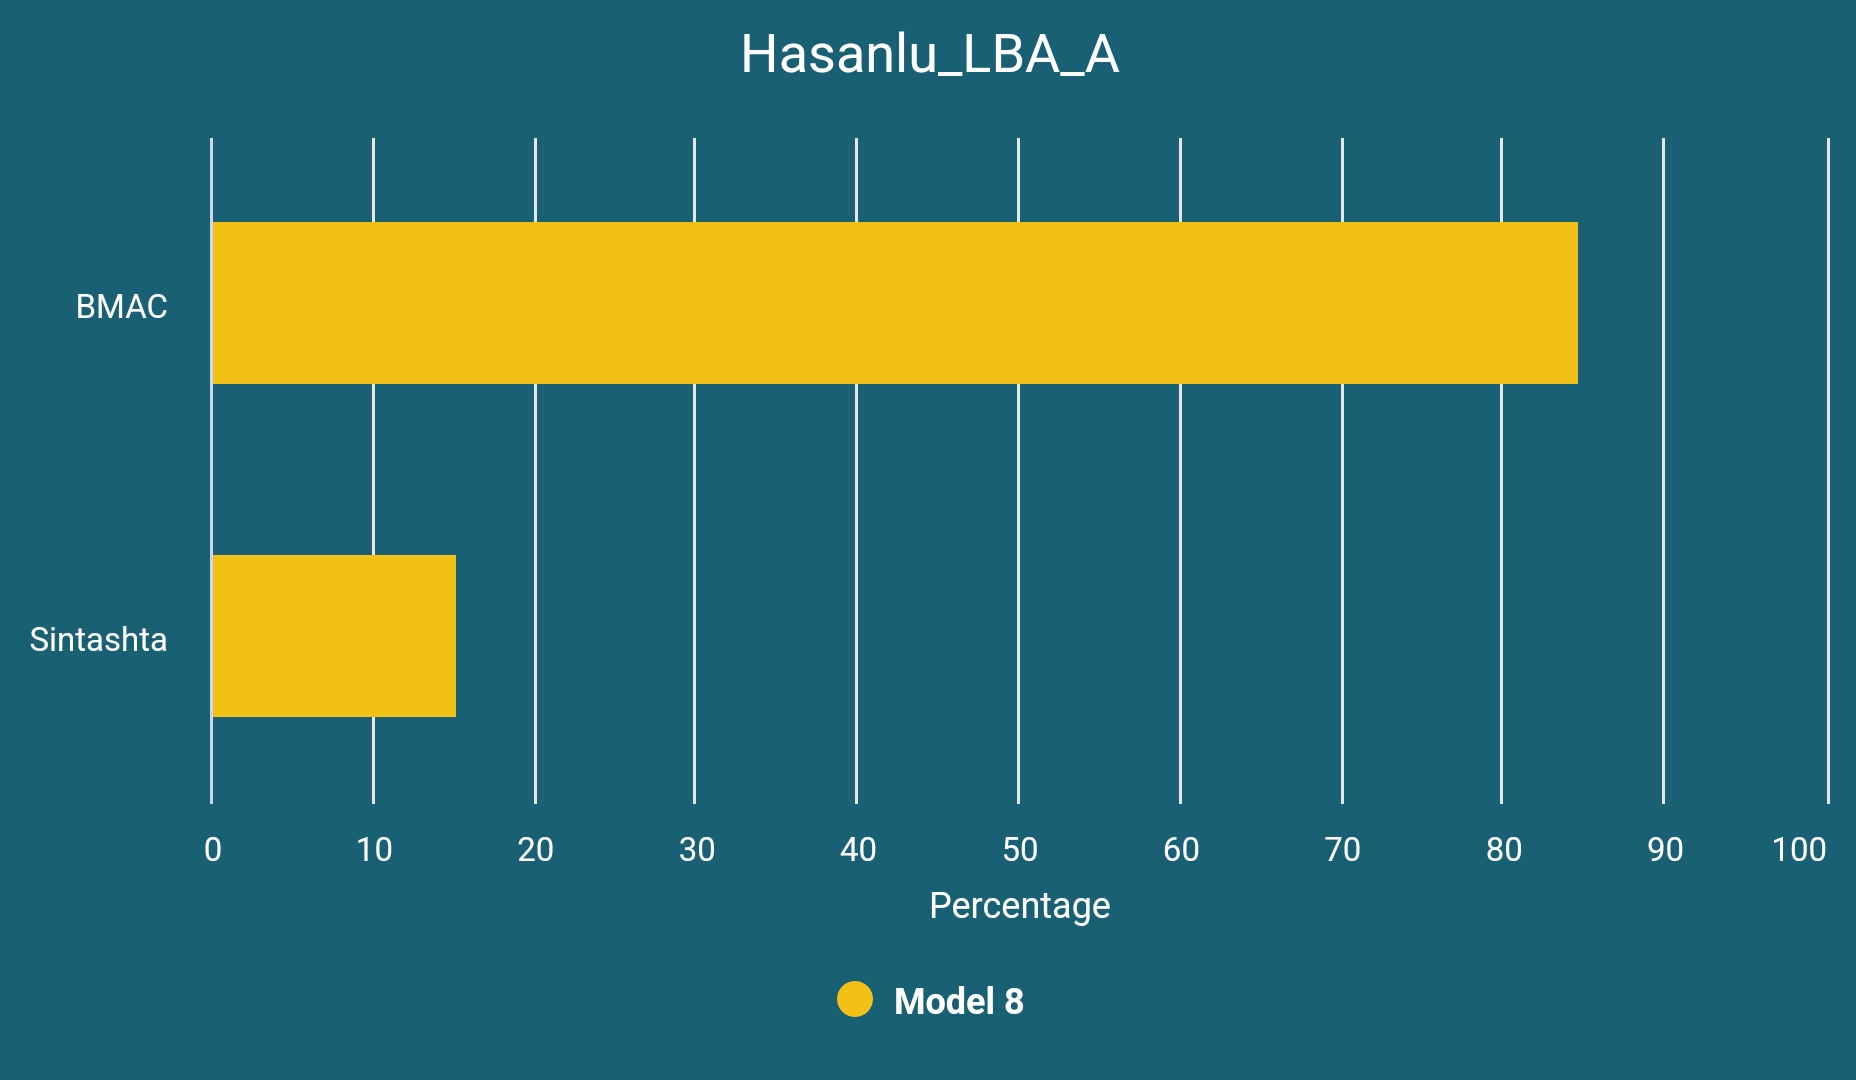
This is most likely an Indo-Aryan (Mitanni-related) migrant from Central Asia. Although the authors of the paper argue against an Indo-Iranic presence in Hasanlu, the lack of Y-DNA R1a, which is their main argument against the Indo-Iranic presence, does not prove anything especially considering the quite low R1a presence among the Iron Age Swat Valley samples.4 Therefore; 1. There is no sufficient evidence to think that heavily BMAC-derived Indo-Aryans were all paternally steppe descendent and 2. The absence of the abovementioned evidence (R1a) is not the evidence of the absence of Indo-Iranics. Also we have additional reasons to think otherwise: well-known names of the field like Parpola,5 Dumézil,6 Kuzmina,7 C. Young,8 Francfort9 and Kurochkin10 all have interpreted some of the foundings from the site as Aryan-related (either Indo-Aryan or Iranic).
Since the introduction of Hasanlu_LBA_A-like ancestry is too early for the Iranic presence in the region (see the dating of DinkhaTepe_BIA_B samples below) and considering the fact that the Indo-Aryan charioteers, Maryannu, have established themselves as a superstrate among the Hurrians who were most probably also existed in the region, our conclusion is that Hasanlu_LBA_A is most likely an Indo-Aryan migrant from Central Asia.

DinkhaTepe_BIA_B
The samples that are labeled as DinkhaTepe_BIA_B (n=8) are dated to 1881-841 BCE and can be modeled as a two-way mixture of DinkhaTepe_BIA_A and Hasanlu_LBA_A:
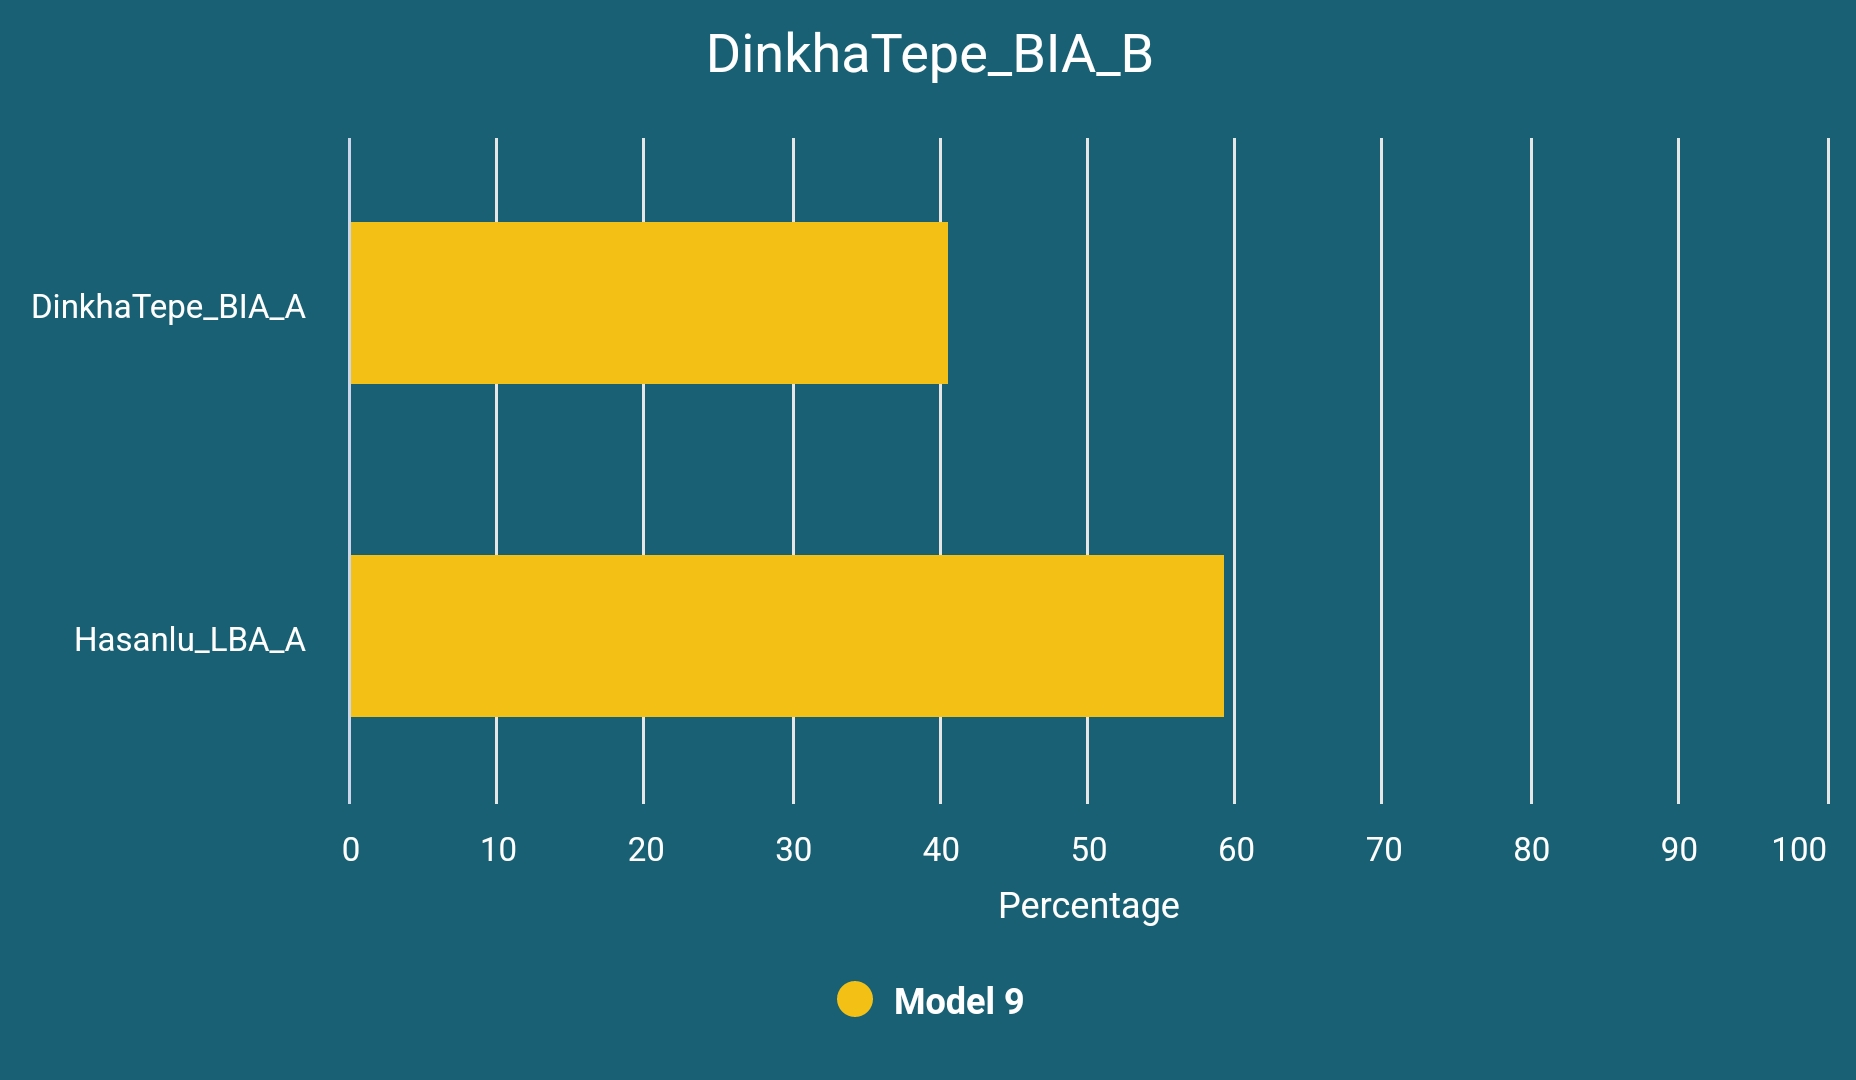
These could be representing the mixed Mitanni Indo-Aryans and their likely descendants, Matieni. It is also possible that this seemingly stable genetic profile is due to constant migrations from Central Asia and the following mixing.
Hasanlu_IA
Iron Age Hasanlu samples (n=18) are dated to 1377-787 BCE. We have found that there are two different clusters of Hasanlu_IA: first one (n=13) can be considered as a continuation of Hasanlu_LBA_B and the second one (n=5) of DinkhaTepe_BIA_B.
Thus we may conclude that there were at least three different genetic clusters in the Early Iron Age northern Zagros: DinkhaTepe_BIA_A-like (Hurrians?), Hasanlu_LBA_B-like (probably speakers of something related to the unknown language of their mostly local predecessors, Turukkaeans?) and DinkhaTepe_BIA_B-like (Matieni?). Since it is possible for the earliest Iranic migrants to the region to be genetically similar to Hasanlu_LBA_A, it might be impossible to detect them solely based on autosomal DNA, but it might well be the case that they had already began penetrating increasingly; especially considering that the generally accepted entrance date for them is somewhere between 1200 and 900 BCE.
The rest of the article is still free and hopefully will stay so, but if you have read this far and appreciated what you have seen, please consider supporting my work on Patreon.
I am an archaeologist who mainly works on ancient Indo-Iranic cultures. I have published many articles and videos on archaeogenetics and ancient religious traditions in English and Turkish, some of which have been translated into Kurdish and Persian. Eliminating the fallacies surrounding these areas of research (that are generally born out of ideological sentimentality or romanticism regarding one's own ancestors) and providing reliable information in a clear, systematic and analytical way are my main objectives. I would be more than glad if you choose to support my work!
May the xᵛarənah be with you!
Iron Age Iranics of Central Asia
Yaz II
Yaz Culture is considered to be an Iranic one and the only sample we have, DA382, is dated to its second period (around 850 BCE). It can basically be modeled as below:
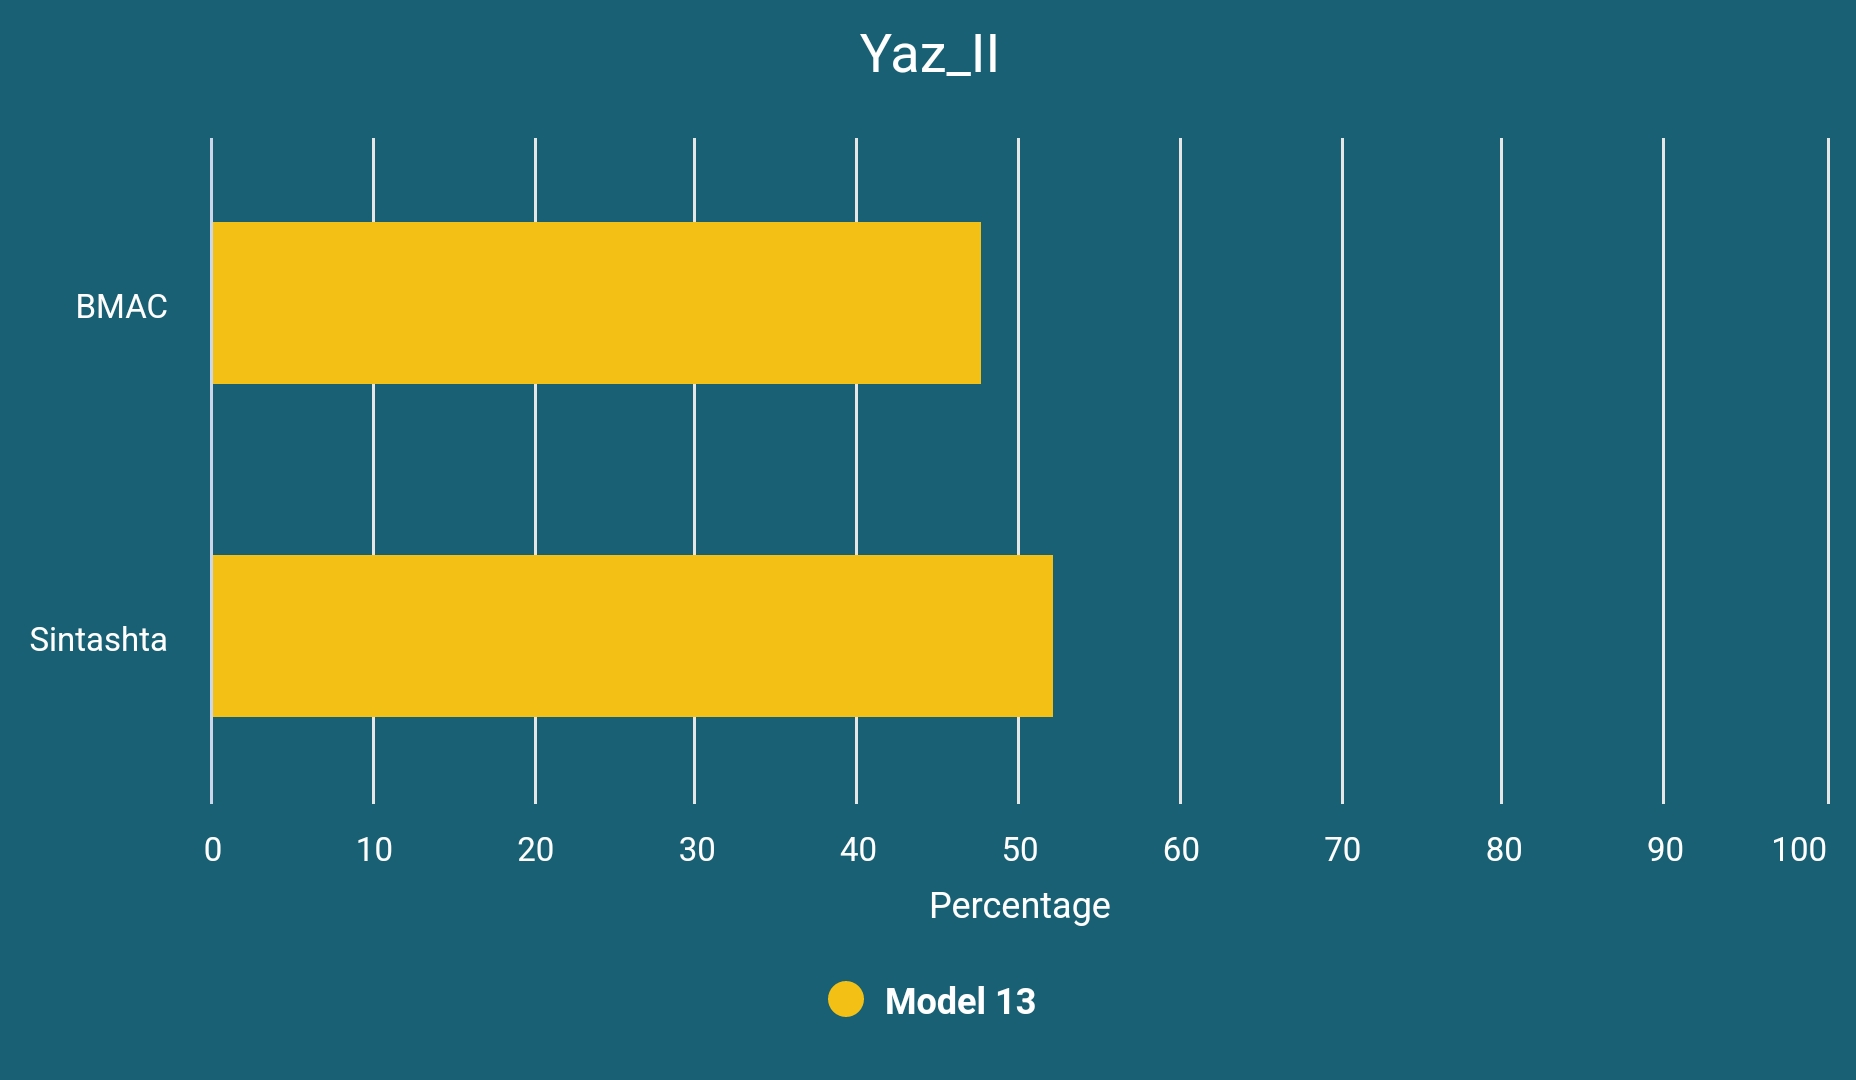
To those who would like to learn about the deeper ancestry of Sintashta and BMAC, the former is approximately 0.7 Western Steppe Herder and 0.3 Globular Amphora-derived while the latter is 0.65 Neolithic Zagrosian, 0.25 Neolithic Anatolian Farmer and 0.1 Western Siberian Hunter-Gatherer-derived.11
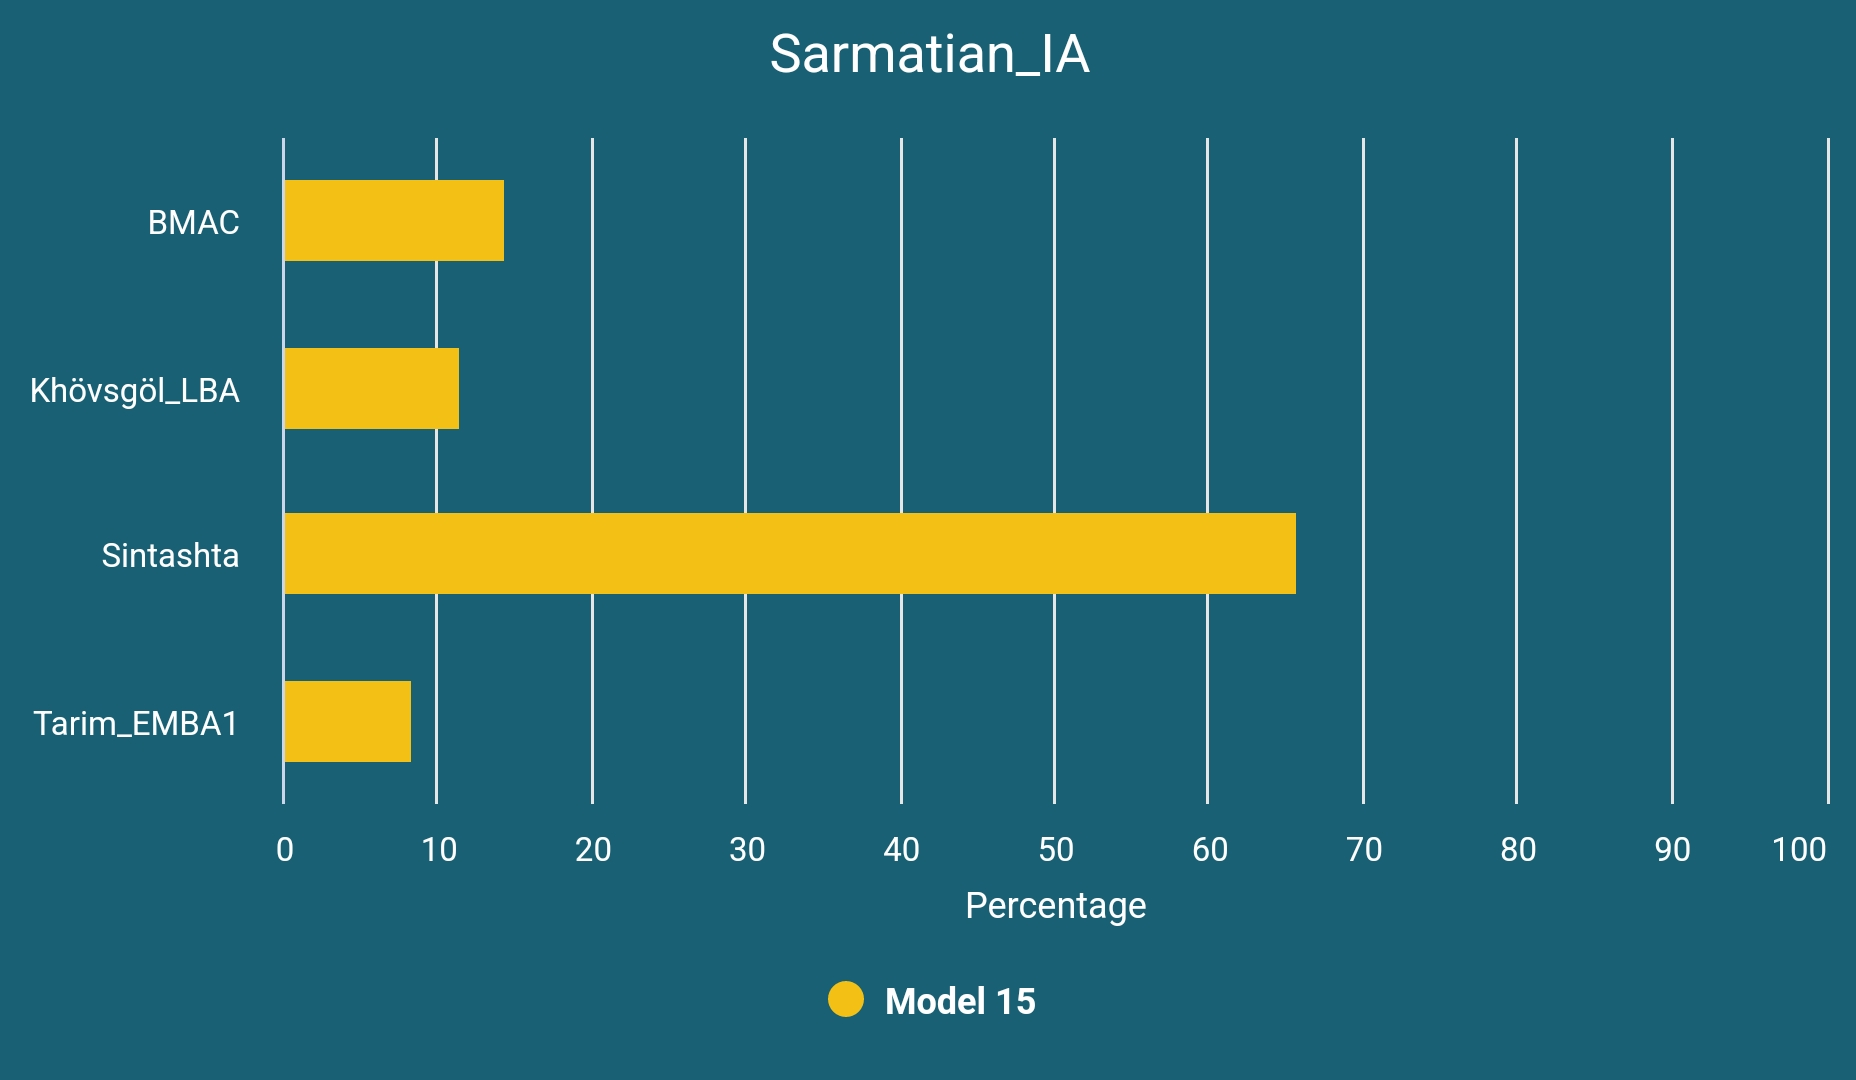
Sarmatian_IA
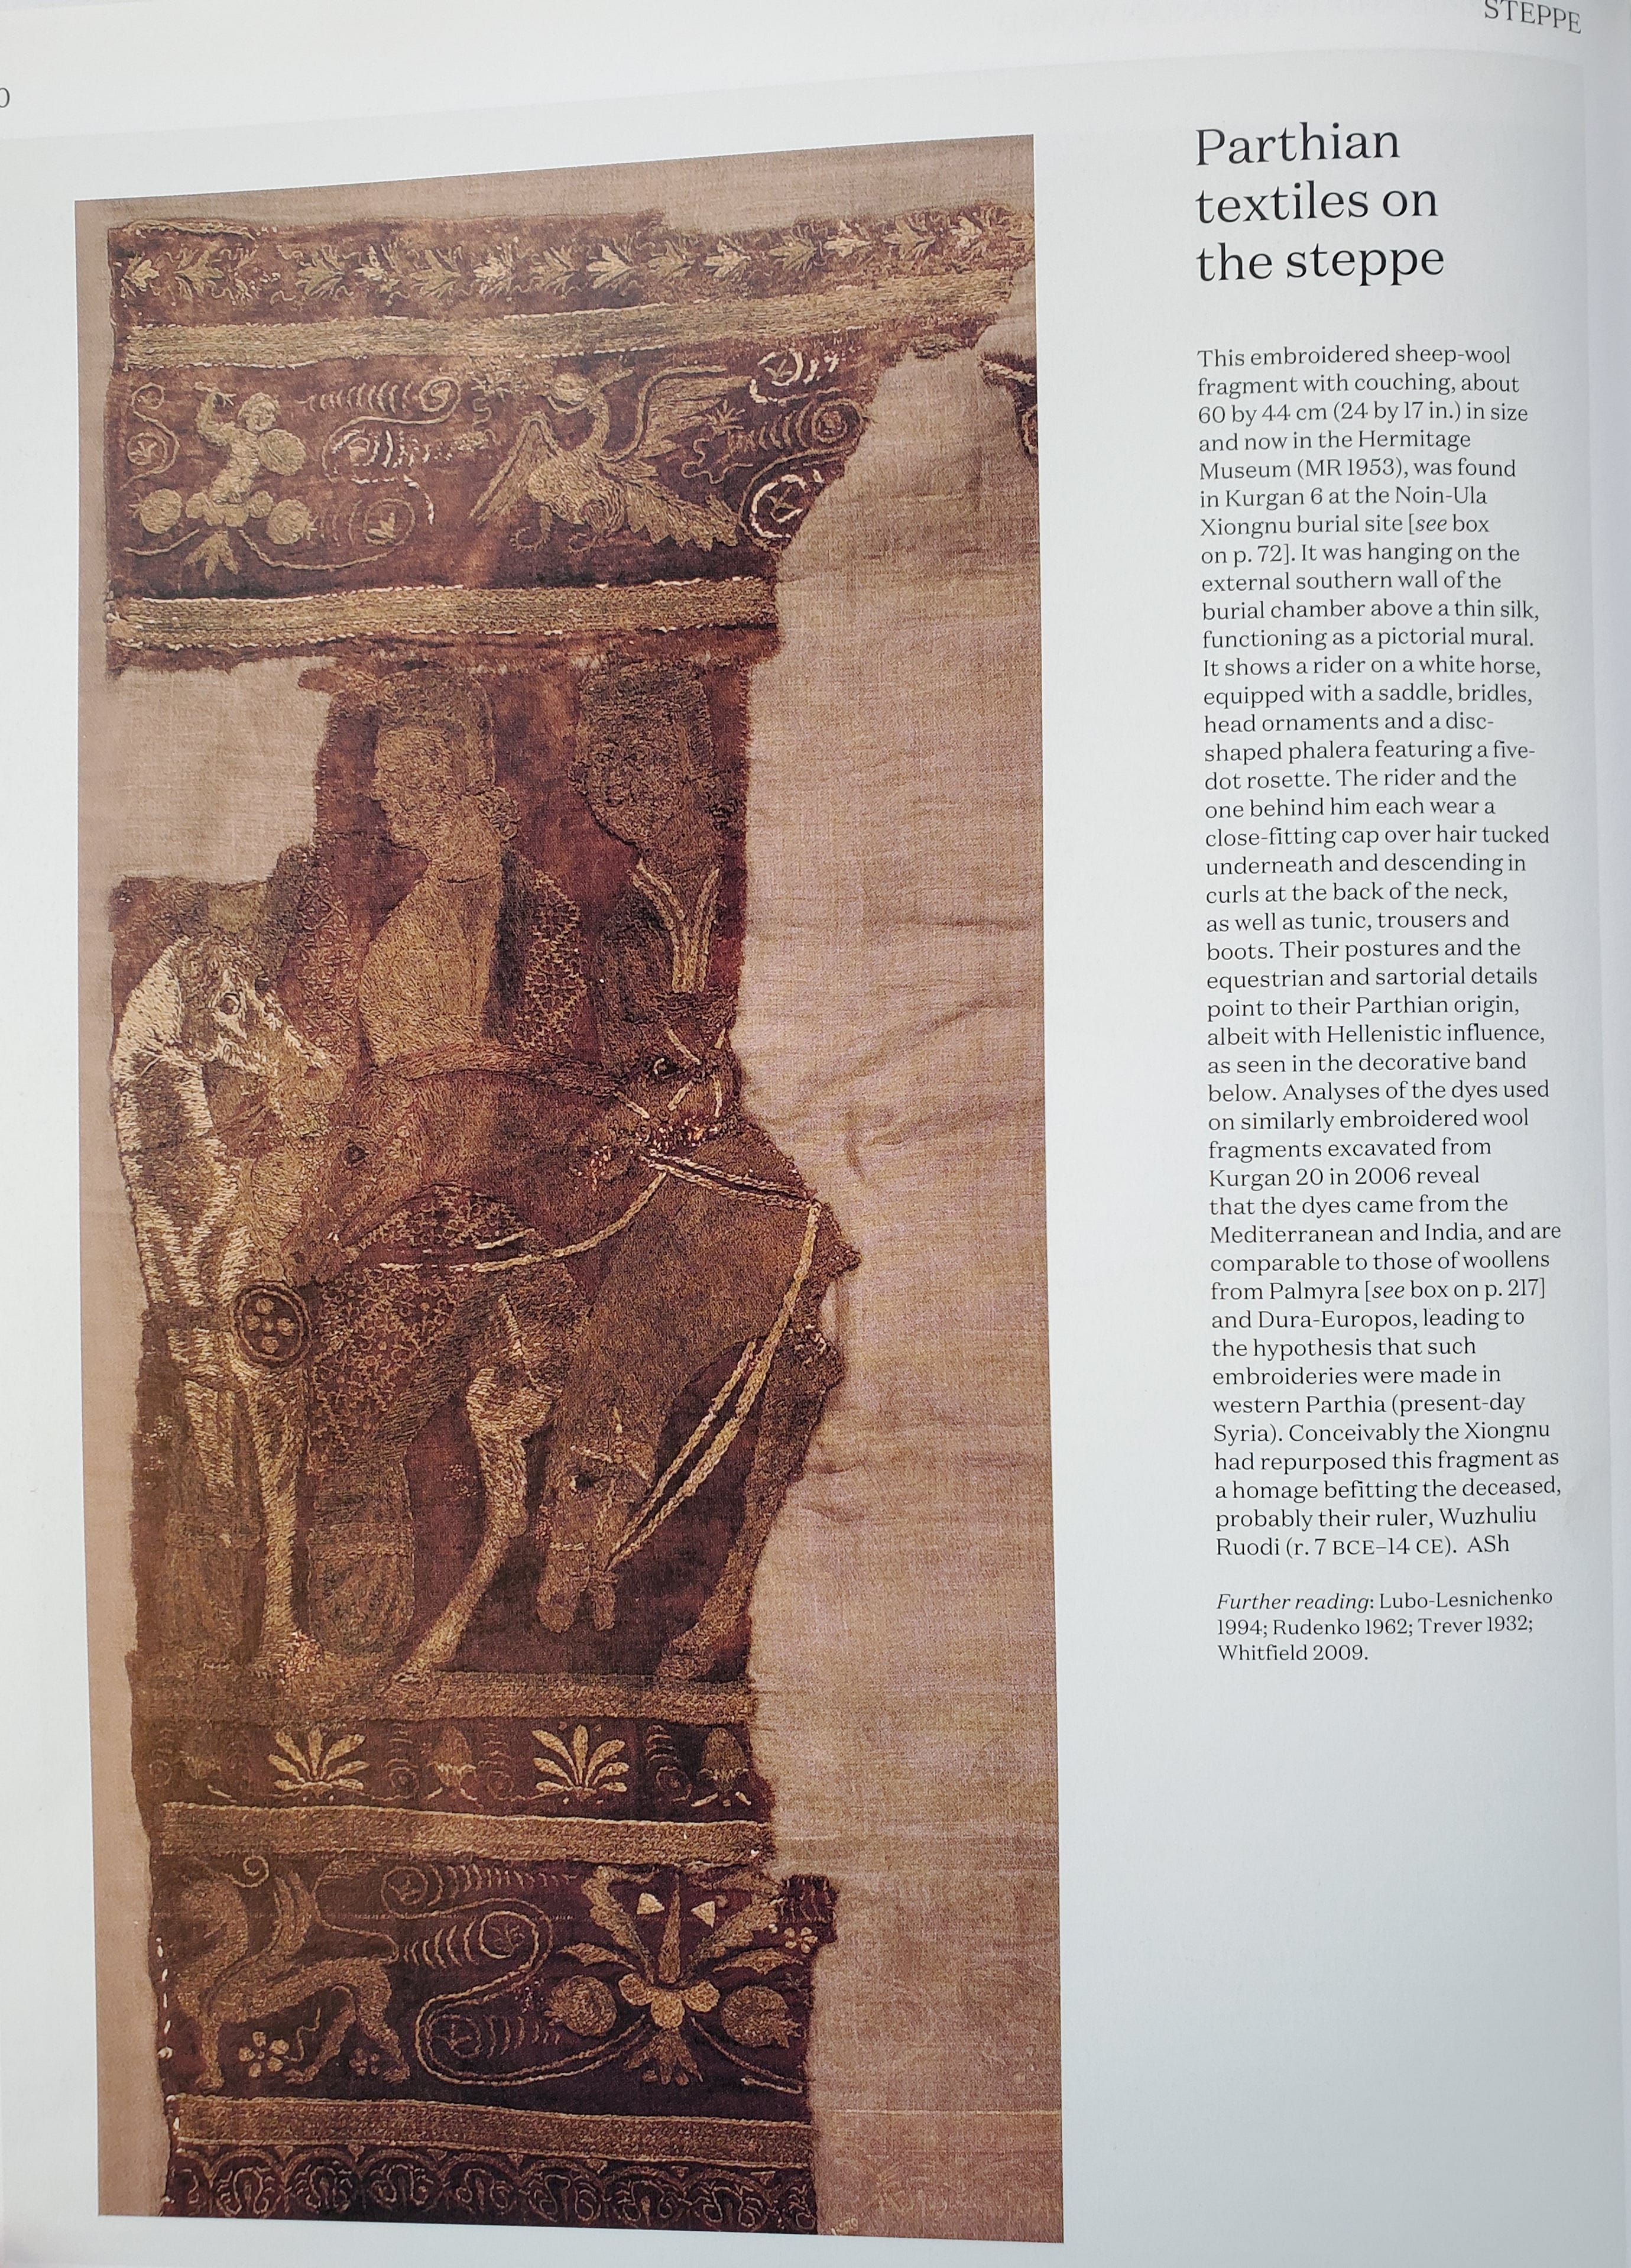
The Parthian Arsacid Empire which has left lasting effects on the northern Zagros region was founded by Arsaces I who led the Parni tribe into Parthava. Later Parthian-speakers were likely a result of a mixture of Parni and pre-Parni Iranics (Mede-like) of the region.12 Since Parni is generally considered to be one of the tribes of Dahae confederacy, it is possible that they were resembling their Sarmatian cousins on the Caspian steppe to some extent; although the Parni region was to the southeast of the Caspian Sea and thus it is possible for them to display a more southern genetic profile than the Sarmatian_IA's (samples are dated to between 800 and 200 BCE) analyzed below:
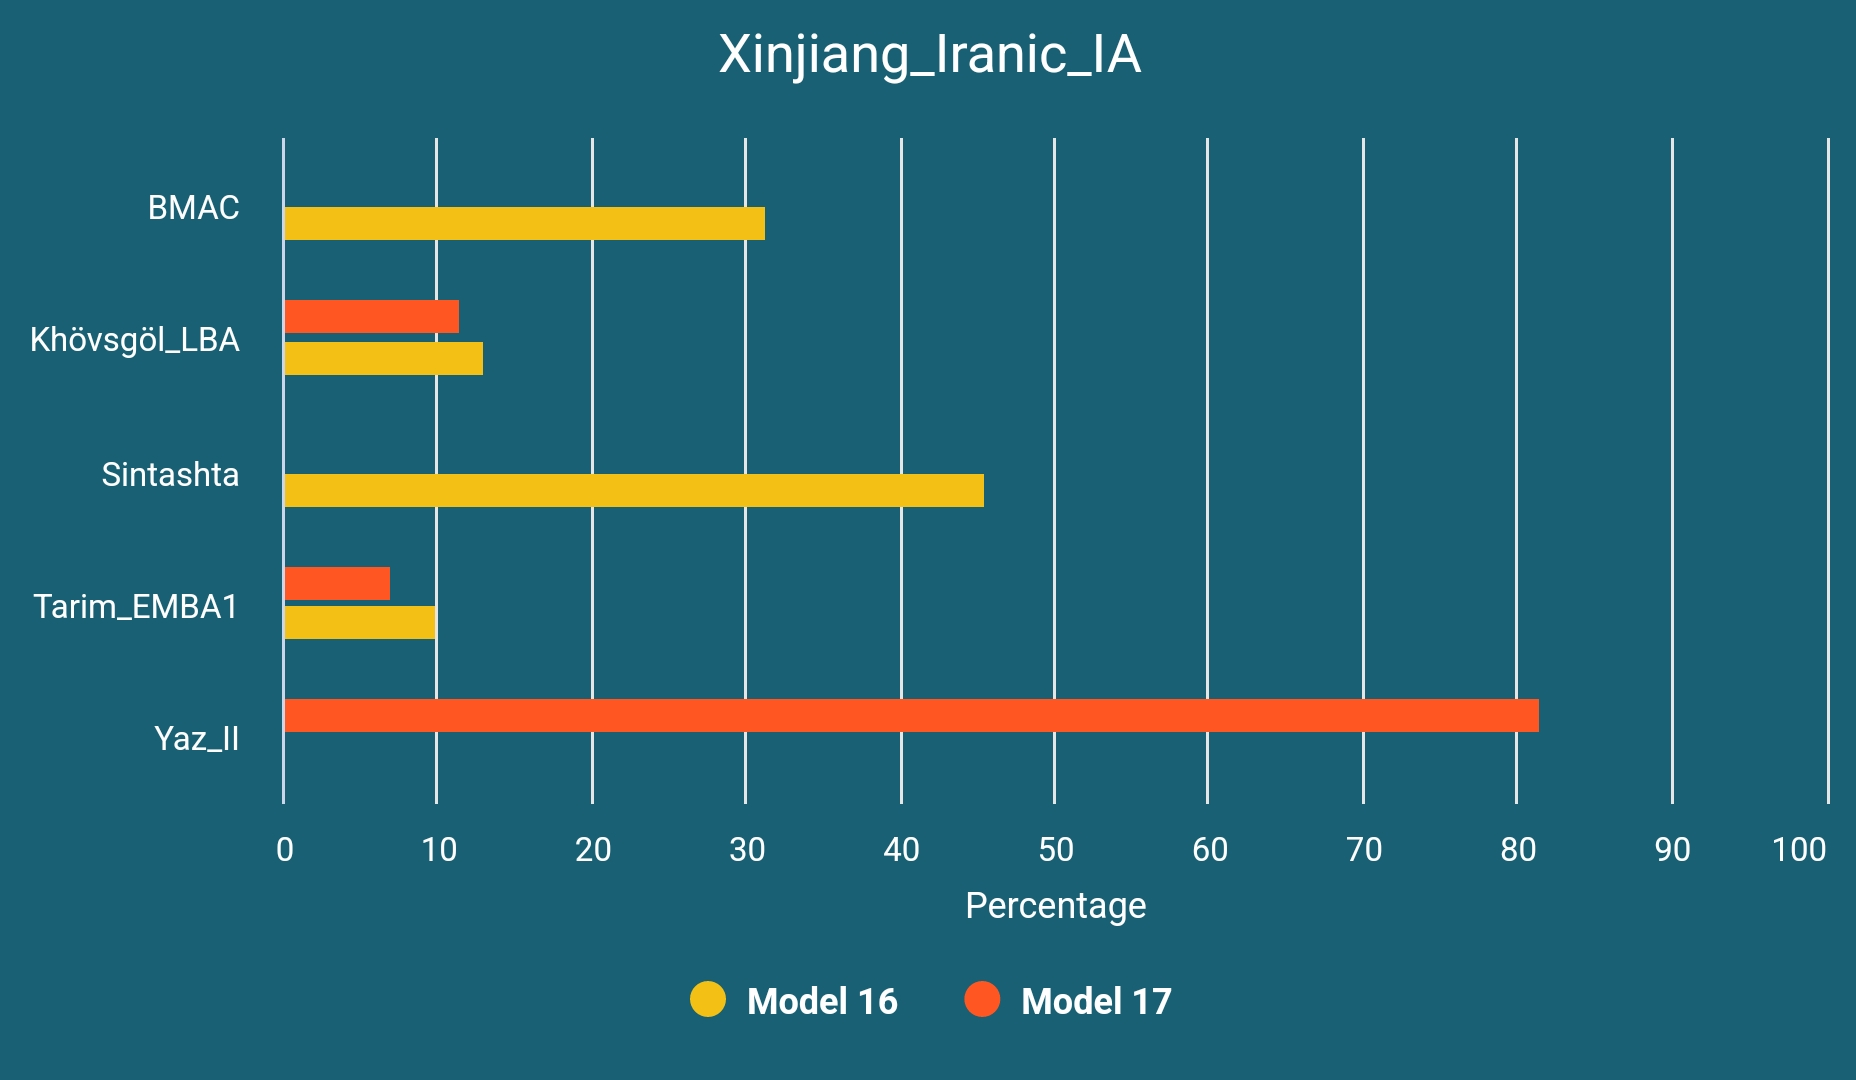
Xinjiang_Iranic_IA
We have searched for a more eastern cluster than DA382 and Sarmatian_IA to represent different potential sources for Iranic ancestry of the later Kushan era samples. This would make sense especially when we consider the Yuezhi migrations. We have found four Iron Age Iranic samples from Eastern Central Asia (one from Alai Nura, Kyrgyzstan and three from Xinjiang, China, dated to between 800 BCE and 239 CE) that fall in the same genetic cluster and they can be modeled as below:
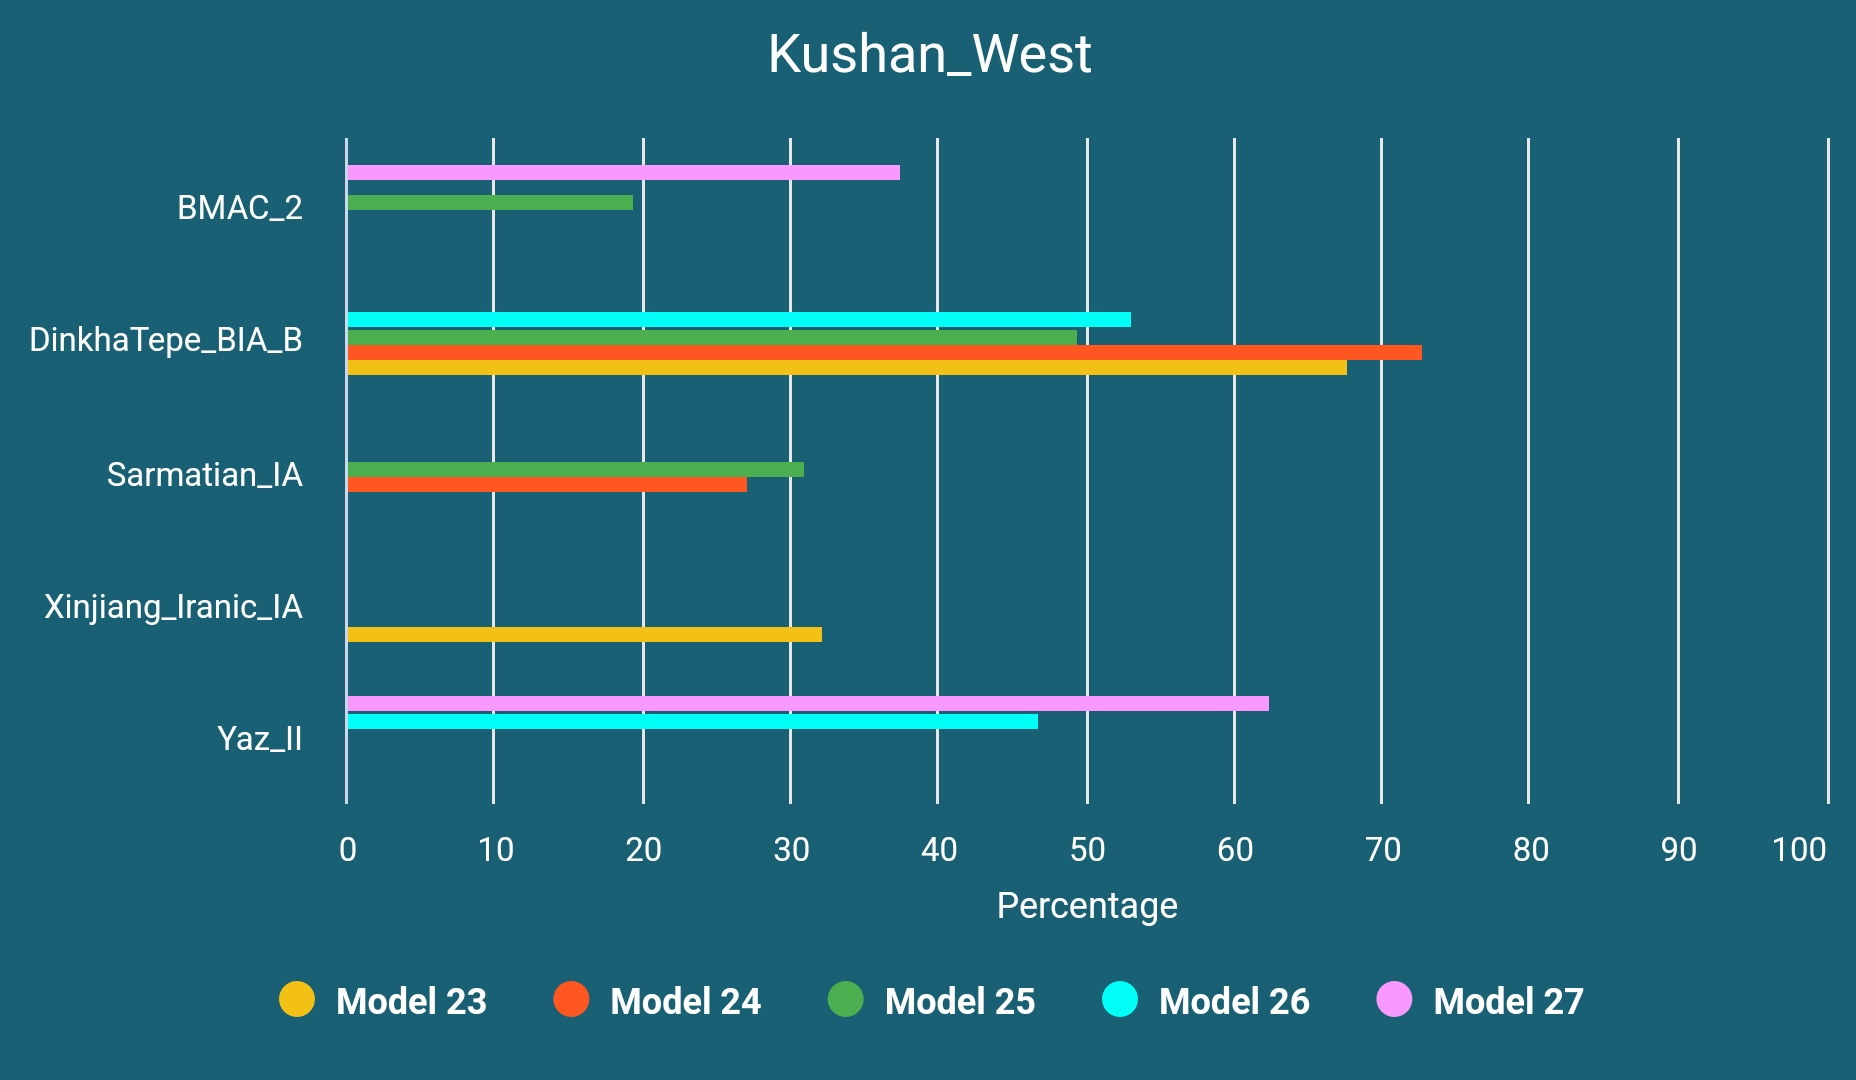
Kushan Era Samples
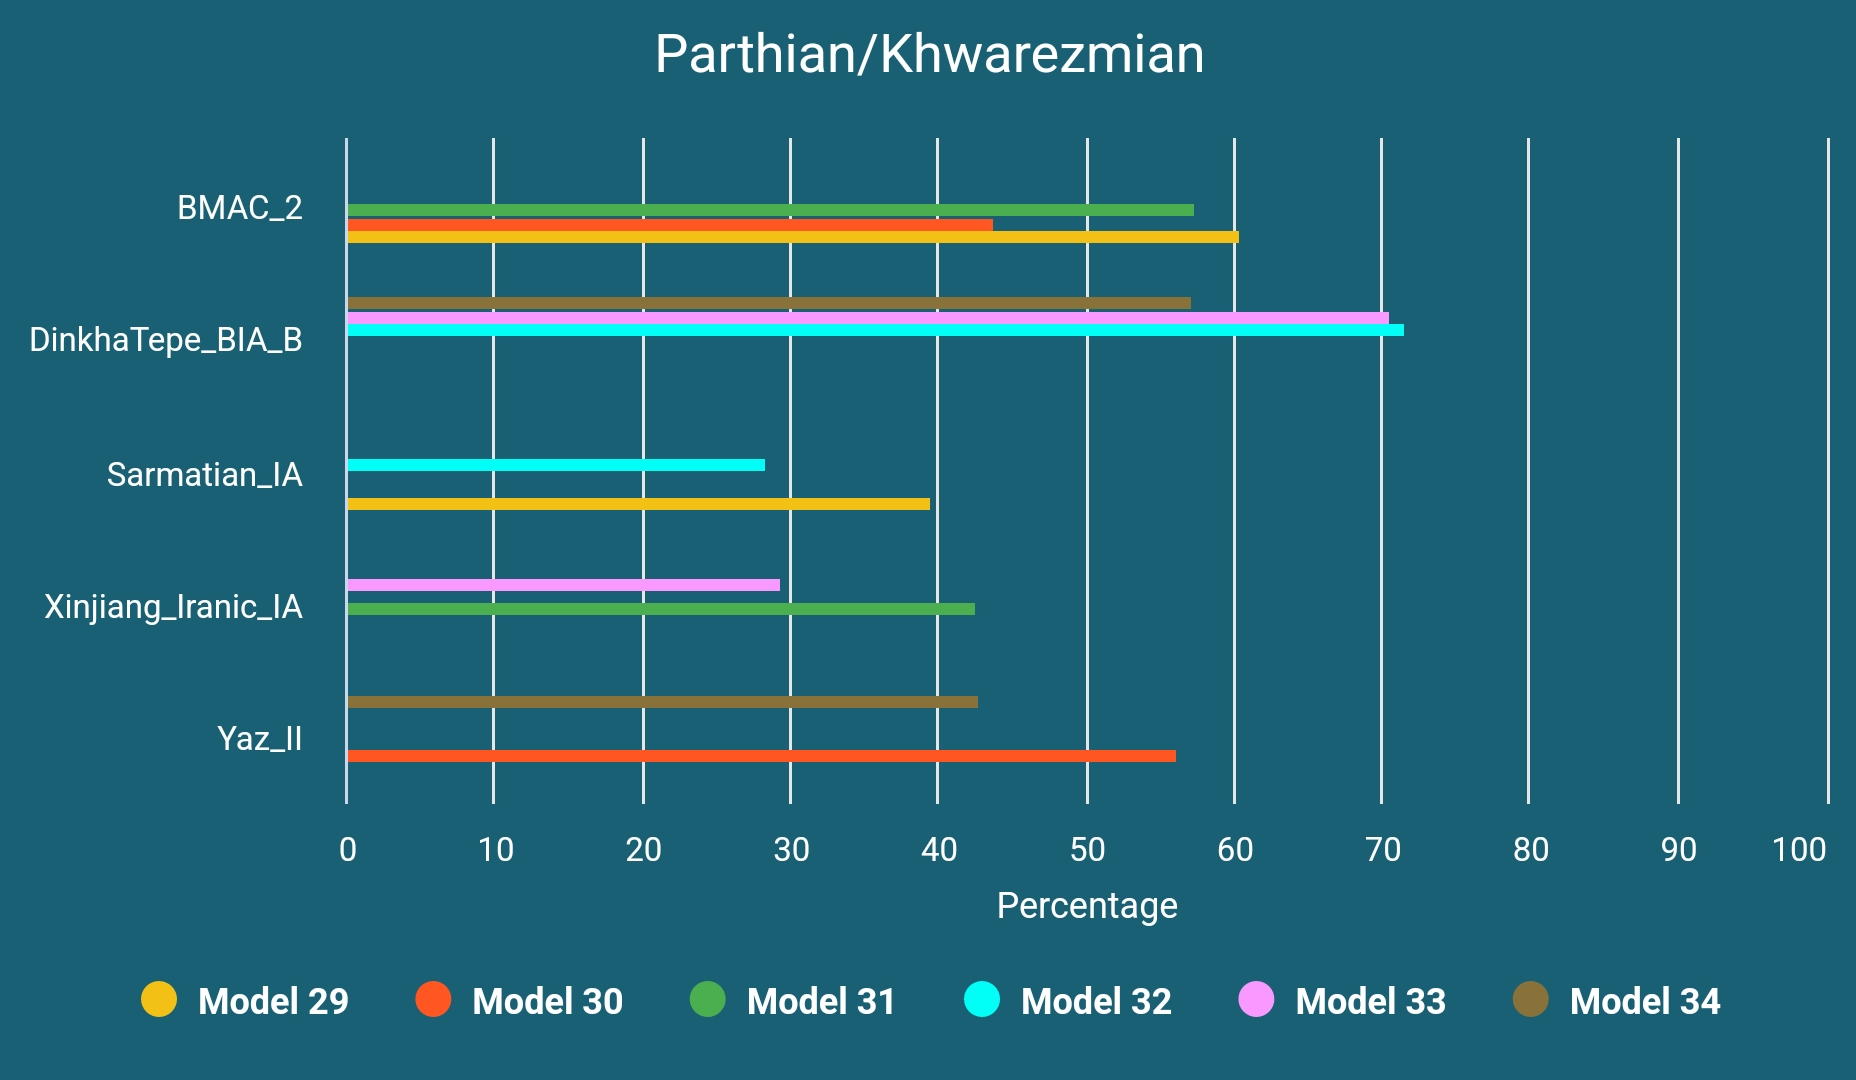
We have analyzed 13 Kushan era samples from Tajikistan and Uzbekistan and concluded that they fall into four different clusters: all shifts being relatively, western/Zagrosian-shifted (n=6, one excluded due to familial relationship), northern/steppe-shifted (n=4), eastern-shifted (n=2) and northeastern-shifted (n=1). We do not know if they were speakers of the same language. Recently Dilawer Khan has proposed the possibility of one of these western-shifted Kushan era samples to be actually a Parthian, emphasizing the geographical and temporal overlap.13 While it is quite possible (especially when compared to another Iranic sample from Mongolia which you will read about soon), it would not make less sense to assume that some Kushans, Parthians and Khwarezmians have shared more or less the same genetic profile.
Since two eastern-shifted Kushan era samples do not provide good amount of SNPs and one northeastern-shifted sample does not seem to be related to the population movements history around Zagros Mountains, we have decided to continue our analysis with northern and western-shifted samples. The BMAC_2 in below models represents two slightly western-shifted BMAC samples from Sapalli Tepe.
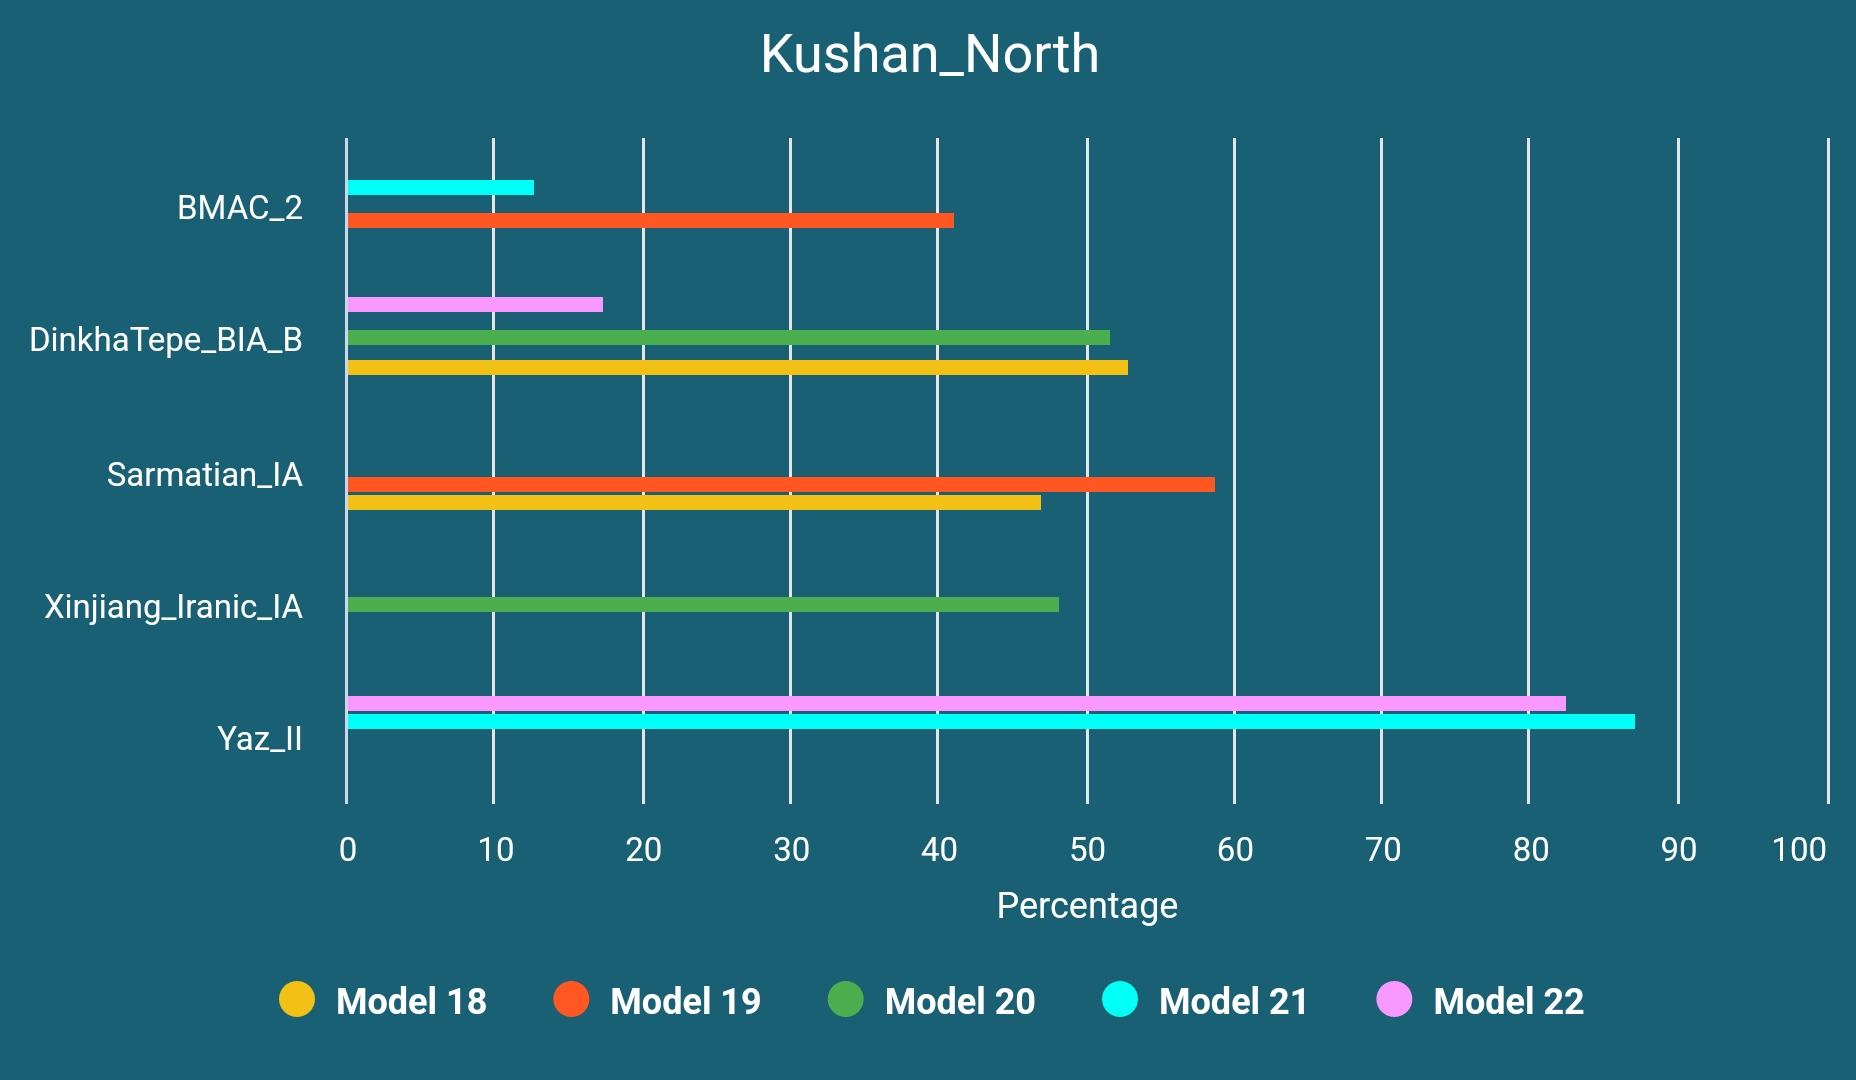
By the time this Western-Central Asian mixture happened the source of DinkhaTepe_BIA_B-like ancestry could have been an already Western Iranic-speaking population (like Medes) but for now we do not have any evidence.
A Likely Parthian or Khwarezmian Sample from Mongolia
This sample, TUK001, is almost indistinguishable from western-shifted Kushan era samples and was found in a Xiongnu burial site in Tamiryn Ulaan Khoshuu but dated to Xianbei period. We know for a fact that Parthians have traded with Xiongnu and also "...recent excavations at this site have yielded artifacts, such as pottery from the Kwarezm oasis cultures near the Aral Sea and coins of the Sassanian Persian empire, that indicate significant interactions with areas in Central Asia and much farther west."14
So it is reasonable to assume it as being either a Khwarezmian or a Parthian sample and it can be modeled as below:

Early Modern to Contemporary Zagros
Safavid Era Ganj Dareh Sample
The sample we have from early Safavid era, I1955, is most likely of a Kurd.
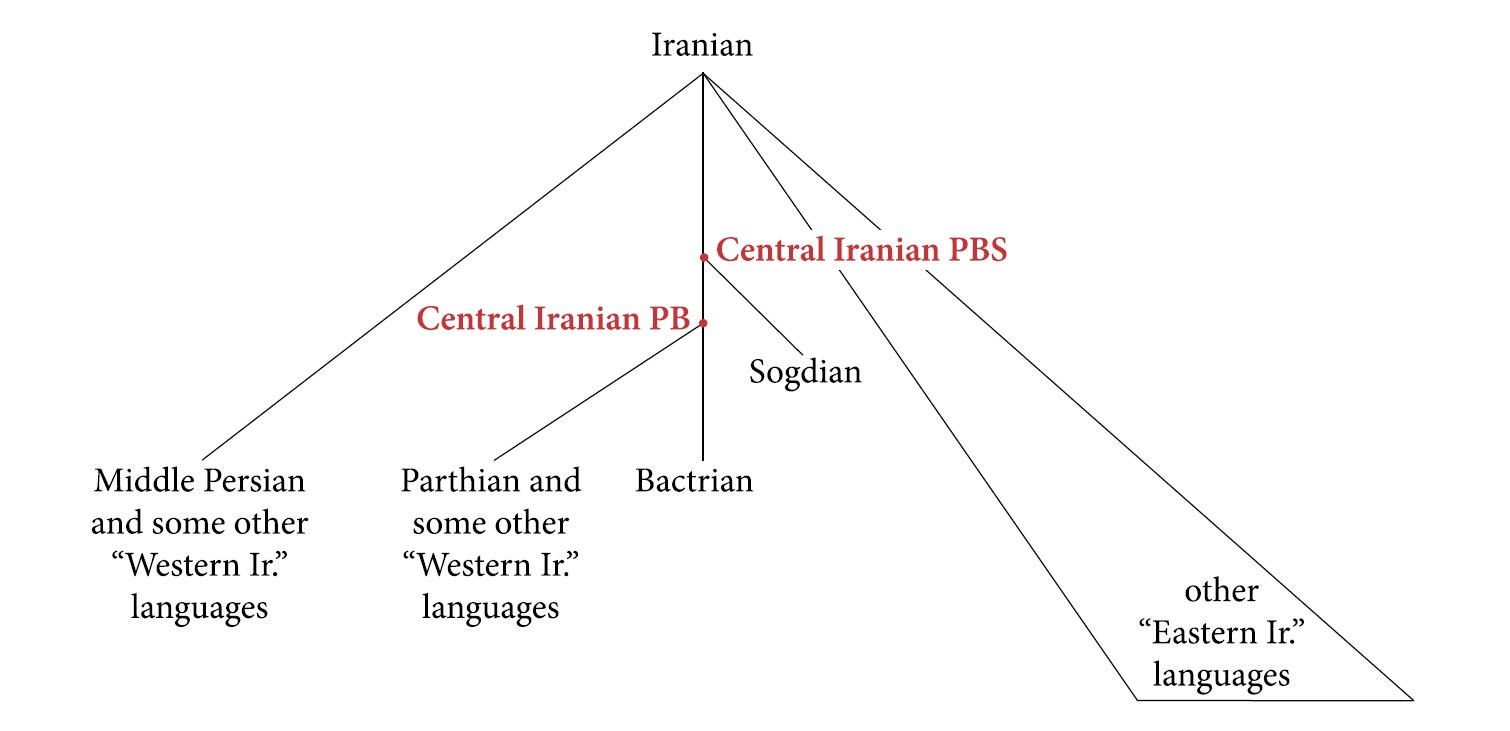
Windfuhr identified Kurdish dialects as Parthian, albeit with a Median substratum. Both Windfuhr15 and Frye16 assume an eastern origin for Kurdish and consider it as related to eastern and central Iranic dialects. Recently Korn has suggested another subdivision for Iranic languages and proposed a Central Iranian subbranch which has a seemingly reconstructible proto phase unlike most putative subbranches like Eastern or Western Iranic and includes Parthian, Bactrian (official language of the Kushan Empire), Sogdian and some modern languages that are generally considered as Western Iranic, like Zazaki and maybe Kurdish.17
Based on these assumptions we have decided to model this Safavid era sample as below and these models turned out to be quite successful:
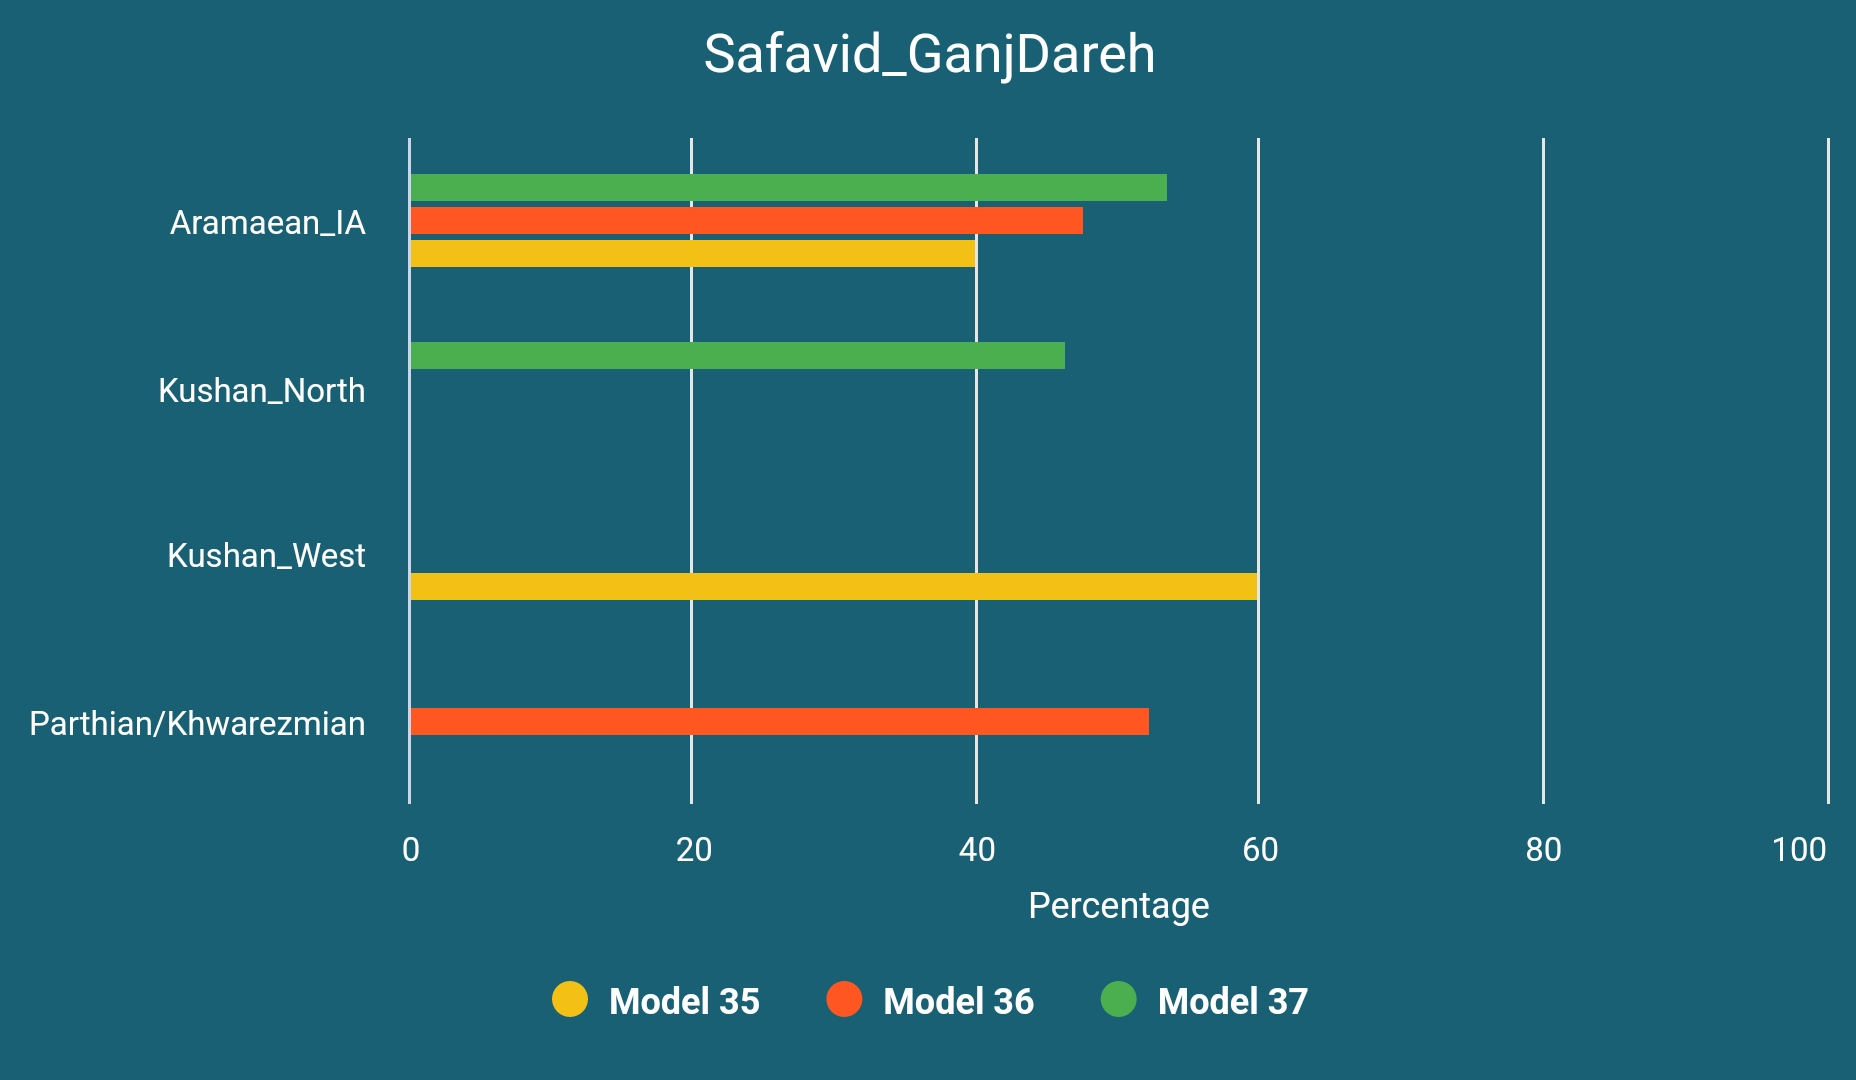
The likely Aramaean samples are from Batman, Turkey and dated to between 800 and 1 BCE. Their genetic profile is basically the same with DinkhaTepe_BIA_A.

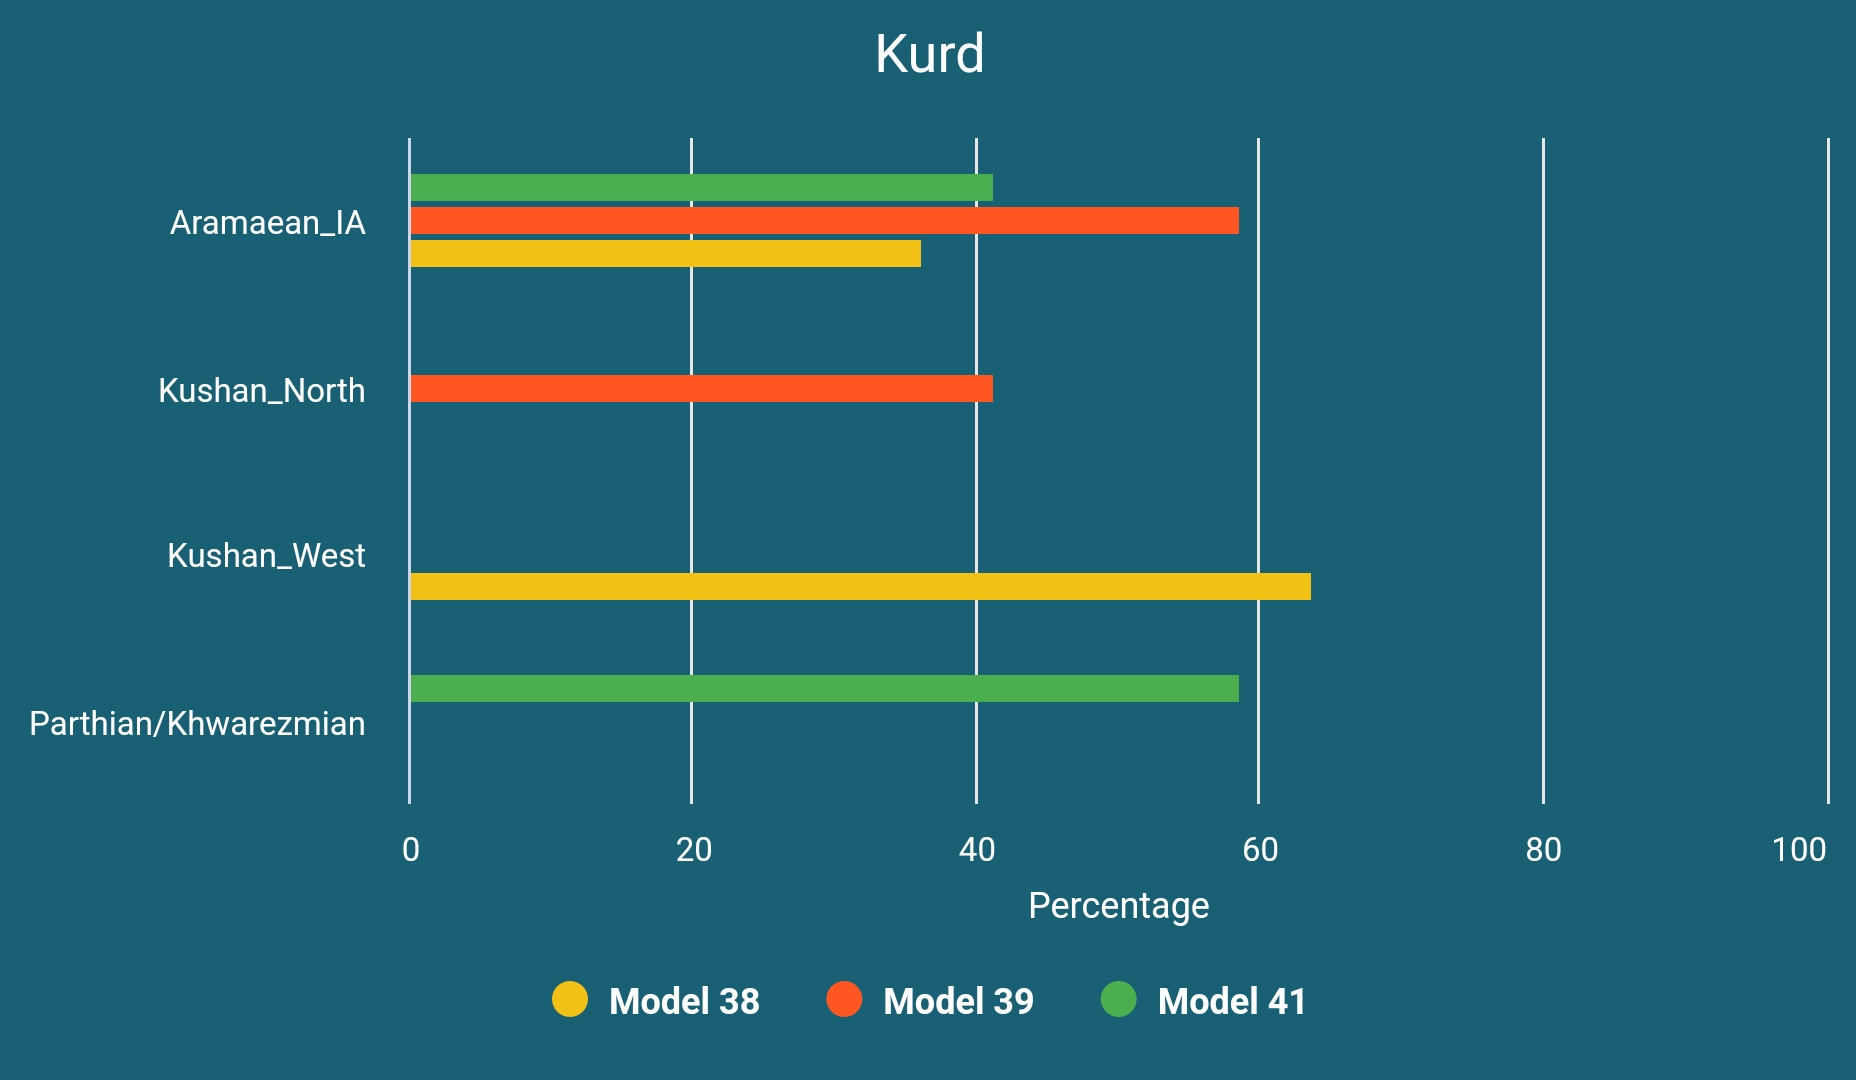
Modern Kurds
Modern Kurds are basically the same with Safavid era Ganj Dareh sample and can be modeled as below:
All Models in Chronological Order
Updates (01.12.2022)
Special thanks to all readers who have contributed with their comments.
Levent İlhan has suggested that it is more likely for Bronze Age inhabitants of Lake Urmia region to be Turukkaeans instead of Lullubians or Gutians. We think he is right and have edited accordingly.
Mücahit Yurt has pointed out the possibility of Parthian/Khwarezmian and Kushan era samples to be a mixture of Sarmatians of eastern Caspian steppes and BMAC-like populations. We have decided to include both populations as sources in our models.
Our another reader, Kount, has proposed the possibility of Hasanlu_MBA to be a mixture of HajjiFiruz_BA with SehGabi_C instead of HajjiFiruz_N. We have added the results of this model to our table.
Lazaridis, I. et al. (2022). The genetic history of the Southern Arc: A bridge between West Asia and Europe. Science, 377 (6609), DOI: 10.1126/science.abm4247
Seven, N. (2022, November 26). Supplementary Material for A Genetic Analysis of Historical Population Movements Around The Zagros Mountains. Retrieved from https://drive.google.com/drive/folders/1Gri2YL7uo3RYgayYRLSE_AD8EjdtDIpr?usp=sharing
Parpola, A. 2020. Royal “Chariot” Burials of Sanauli Near Delhi and Archaeological Correlates of Prehistoric Indo-Iranian Languages. Studia Orientalia Electronica, 8 (1), https://doi.org/10.23993/store.98032
Narasimhan, Vagheesh M. et al. (2019). The formation of human populations in South and Central Asia. Science, 365 (6457), https://doi.org/10. 1126/science.aat7487
Parpola, A. (2015). The Coming of the Aryans to Iran and India and the Cultural and Ethnic identity of the Dāsas. Studia Orientalia Electronica, 64, 195–302. Retrieved from https://journal.fi/store/article/view/49745
Francfort, H.P. (2008). A Note on the Hasanlu Bowl as Structural Network: Mitanni-Arya and Hurrian? Bulletin of the Asia Institute, 22, pp. 171-188.
Kuzmina, E. (2007). The Origin of the Indo-Iranians. Brill.
T. Cuyler Young Jr. (1967). The Iranian Migration into the Zagros. Iran, 5:1, 11-34, DOI: 10.1080/05786967.1967.11834760
Francfort, H.P. (n 6)
Erdosy, G. (Ed.) (1995). The Indo-Aryans of Ancient South Asia. Walter de Gruyter.
Narasimhan, Vagheesh M. et al. (n 4)
Pīroz (2021, October 13). On the Parthian People. Parthava. https://www.parthava.org/2021/10/13/on-the-parthian-people/
Khan, D. (2022, October 18). Post Iron Age Introduction of Y-DNA R1a R-Z94 and East Asian Ancestry into Kurdistan, North Iran, and Turkey with the Parthians and Scythians. Eurasian DNA. https://eurasiandna.com/post-iron-age-introduction-of-y-dna-r1a-r-z94-and-east-asian-ancestry-into-kurdistan-north-iran-and-turkey-with-the-parthians-and-scythians/
Jeong, C. (2020). A Dynamic 6,000-Year Genetic History of Eurasia’s Eastern Steppe. Cell, 183 (4), https://doi.org/10.1016/j.cell.2020.10.015
Windfuhr, Gernot (1975), "Isoglosses: A Sketch on Persians and Parthians, Kurds and Medes", Monumentum H.S. Nyberg II (Acta Iranica-5), Leiden: 457-471
Frye, Richard N. (1984). Handbuch der Altertumswissenschaft: Alter Orient-Griechische Geschichte-Römische Geschichte. Band III,7: The History of Ancient Iran. C.H.Beck. p. 29
Korn, A. (2019). Isoglosses and subdivisions of Iranian. Journal of Historical Linguistics, 9 (2), pp. 239-281, John Benjamins Publishing Company, https://www.jbe-platform.com/content/journals/10.1075/jhl.17010.kor
Kudos to you for investing the time to better understand scientific methods and Kurd demography. I highly encourage others from South & West Asia to do the same. The more the merrier!
Learning to properly use acceptable DNA analysis tools is a steep learning curve as I learned around 10 years ago when I got involved in this and inspite of investing 1000s of hours using and developing new bioinformatics methods I’m still learning.
A quick note about qpAdm which I have discussed a few years ago on my website It’s a great tool but needs to be properly understood.
1- The Null hypothesis in qpAdm is that the mixture model outputted is true. P-value of 0.05 is usually used as a significance threshold. P-value signifies probability there’s Null or no difference from the Null hypothesis of the mixture model being true.
Thus the higher the p-value the more evidence that the mixture model outputted is true. That’s why we favor models with higher p-values. P<0.05 is used to reject the model
2- Years ago we found that the genotyping pipeline type and QC affects p-value. For example mixing Simons samples with 1000G and HGDP and 23andMe as well as joint genotyping such as often used in GATK. We have also found that the flipping of minor and major alleles in Plink also causes issues when Plink processed samples are merged with VCF data obtained directly from genotyping pipelines. Also SNP IDs shouldn’t be taken for granted as we have had to correct 1000s in some datasets.
That’s why we have invested alot of money to acquire powerful computers to do our own fasta file genotyping and review SNP IDs in all samples. We always also address ascertainment bias which can be a killer in DNA analysis.
In science the more evidences you have in support of your argument the better it will be supported. That’s why we go the extra mile in our studies such as
“ Post Iron Age Introduction of Y-DNA R1a R-Z94 and East Asian Ancestry into Kurdistan, North Iran, and Turkey with the Parthians and Scythians” at www.EurasianDNA.com and point out:
1- R1a-Z94 became part of demography of Kurds and other ethnic groups in western Iran more recently than 2500 years ago based on the lack thereof in the hundreds of samples published in the “Southern Arc” study.
2- We corroborate Parthians, Scythians and Turkics being the vector for R1a-Z94 introduction by showing that R1a-Z94 rich populations in West Asia are shifted to the exclusion of Armenians and SW Iranians on the Siberian, E.Asian and C Asian Iranian axis using 20 or so pright references in qpWave and qpAdm. We use both contemporary and higher quality ancients to show this.
@Nezih
Your model using Sintashta can be interpreted as “Sintashta like non R1a” especially in light of the lower p-values and lack of R1a in Hasanlu’s time. It’s clear that pure Sintashtans didn’t exist anywhere especially near W Asia when R1a was introduced to Kurdistan about 2000 years ago. That vector must have been Parthian, Scythian and Turkic
We also were able to reject TKM-IA as BMAC+Sintashta in our study on our website a couple of years ago. Andronovo fared better which makes sense based on their larger distribution and proximity to BMAC.
You’ll find when using better quality samples and more SNPs and more pright references that Kurds model better as Iran-Chl/IA + Scythian/Sarmatian/Parthian than Iran-Chl/IA + TKM-IA
Best, Dilawer
The model for Hasanlu_LBA with Sintashta is wrong. It does not hold up to scrutiny, and neither does it explain the R1b in the Hasanlu samples. I'm afraid you are using it to push agendas rather than arrive at the truth.
I have tried to replicate your model here, but it fails.
https://a-genetics.blogspot.com/2022/11/hasanlu-model-critique.html